
Figure 5.
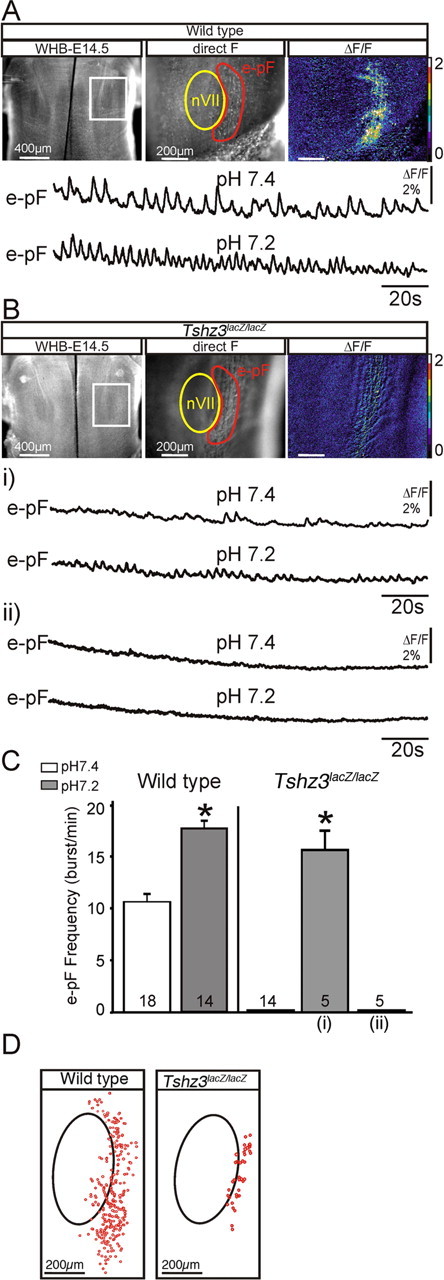
Dysfunction of the e-pF oscillator at E14.5 in Tshz3lacZ/lacZ embryos. A, Photomicrographs of a whole hindbrain preparation (WHB) (ventral view) obtained from an E14.5 WT embryo loaded with Calcium Green-1 AM observed in direct fluorescence at low (left panel) and higher magnification (middle panel). The white rectangle delimits the e-pF area observed at a higher magnification in the two right panels. The facial motor nucleus (nVII) and the e-pF region are outlined in yellow and red, respectively. The rightmost panel illustrates spontaneous calcium transients occurring over the parafacial area as relative changes in fluorescence (ΔF/F). The traces below correspond to transient fluorescence changes recorded in the e-pF region in control conditions, pH 7.4 (top trace), and in pH 7.2 (bottom trace). B, Same legend as in A for Tshz3lacZ/lacZ embryos. Spontaneous calcium changes are disorganized and drastically reduced in some preparations (i, top trace) or completely absent in others (ii, top trace). The bottom traces in i and ii show the response to acidification. Only preparations showing sporadic calcium changes in pH 7.4 exhibit more or less rhythmically organized weak calcium changes in pH 7.2. C, Quantification of rhythmic bursts frequency of the e-pF for WT and Tshz3lacZ/lacZ embryos in control conditions at pH 7.4 (white bars) and at pH 7.2 (gray bars). For the mutants, the response to acidification has been divided in two columns to distinguish between completely silent preparations [rightmost column (ii)] and the slightly more active ones [middle column (i)]. The number of preparations analyzed in different conditions is indicated on each bar. D, Maps of rhythmically active cells (red circles) for a WT preparation (left panel) and a Tshz3lacZ/lacZ preparation (middle panel). The black ovals indicate the position of the nVII. The graph (right) shows the quantification of the mean number of rhythmically active cells detected in five WT (white bars) and six Tshz3 mutant (black bars) preparations. The asterisks indicate significantly different values: p < 0.05. Values are given as mean ± SEM.