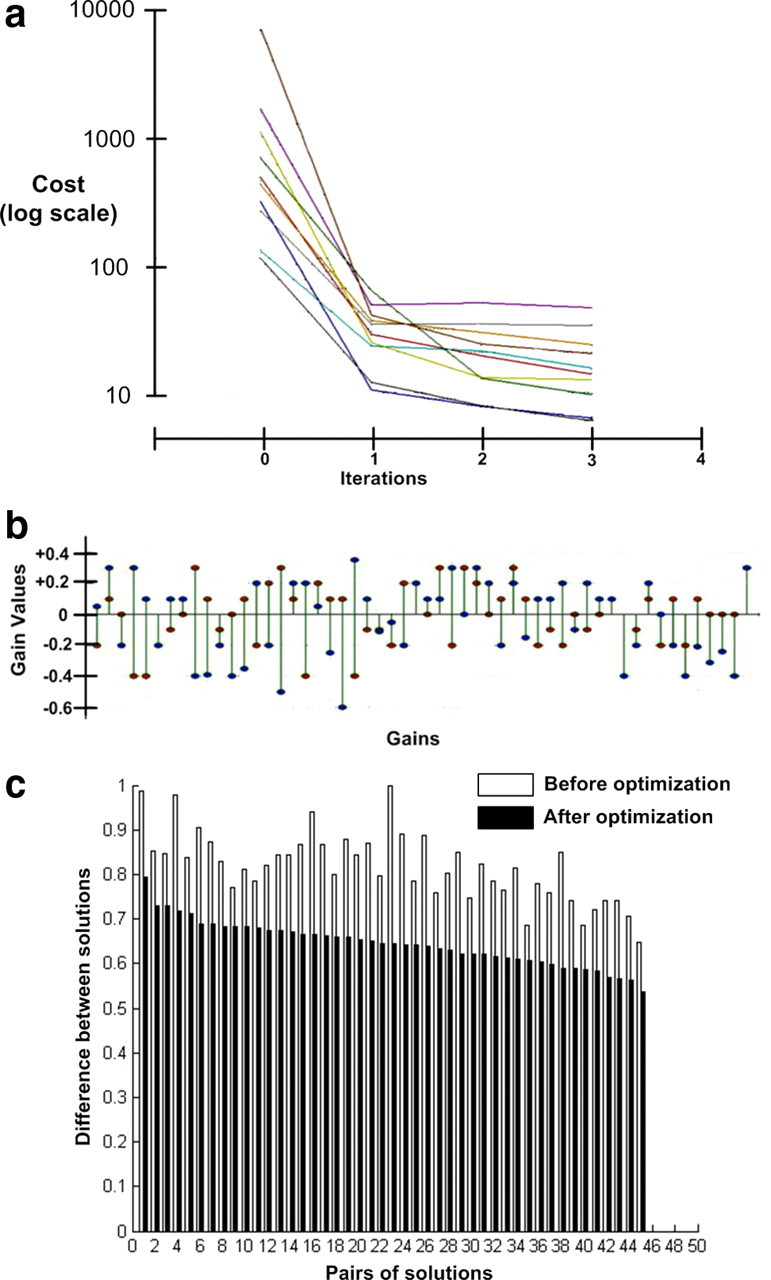
Figure 7.

Analysis of gain values. a, Learning curves for 10 solutions of rapid ramp-hold movements all initialized to different random settings. Even though the initial cost values were considerably different, all curves converged rapidly to stable solutions. b, The final values (ordinate axis) for 54 of the gains from each of two solutions (red and blue circles) from a that achieved very similar cost and kinematic details. They differ substantially in many details, often including both magnitude and sign. c, Distance between the starting and final positions in the high-dimensional state space of gains (square root of the sum of squared distances in all 200 gain axes). The 45 possible pairwise comparisons, ordered according to their distances from each other after optimization.
