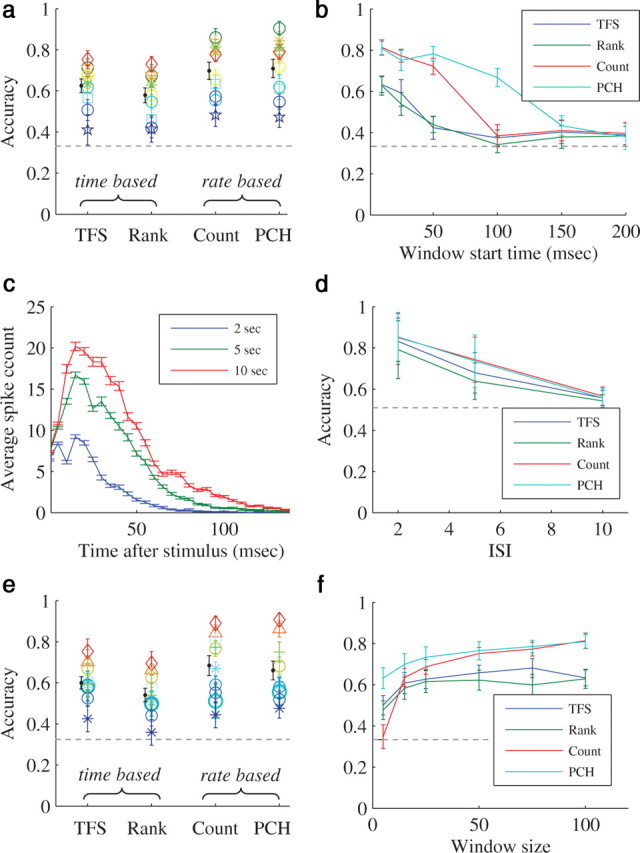
Figure 5.

Representation of interstimulus intervals. Classification accuracy of each representation scheme in temporal experiments. Support vector machine (SVM) algorithm with a Gaussian radial-based function kernel was applied to vectors of training sets (see Materials and Methods). Horizontal dashed line represents chance level. a, Analysis results on all (n = 10) spatial categorization task experiments. Each color represents a different experiment. Results with response window of length 100 ms which starts 10 ms following the stimulation. The black line is the mean ± SD of the classification accuracy in all the experiments. b, An example from one specific temporal experiment, that shows the sensitivity of classification accuracy to the window start time after the stimulus. c, The response envelope. An example from one specific experiment. The average network spikes of all the responses of specific interval as a function of the time after the stimulus (5 ms time bin). Color represents interstimulus interval, error bars represent SEM. Shorter intervals result lower population responses. d, The sensitivity of classification accuracy to the size of the difference between the interstimulus intervals. The average of the classification accuracy between 15 s interstimulus interval and all the remaining intervals (2, 5 and 10) in all of the experiments. Error bars represent SD. The response window is of length 100 ms and starts 10 ms following the stimulation. e, Results with response window of length 100 ms which starts 25 ms following the stimulation. The black line is the mean ± SD of the classification accuracy in all the experiments. f, An example from one specific experiment, that shows the sensitivity of classification accuracy to response window size.
