Figure 3.
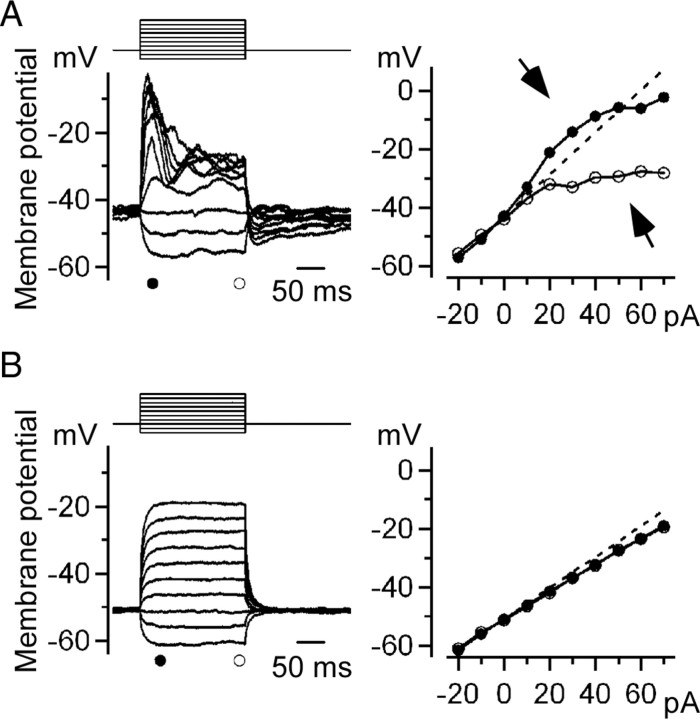
Ca2+ spikes generated by current injection. A, Left, Membrane potential changes induced by current injection. A series of current pulses (10 pA increment from −20 to +70 pA for 200 ms) was injected into a current-clamped Mb1-BC in the dark-adapted retina. The control external solution and the K+-based pipette solution were used. Right, V–I relations obtained from the left panel. The amplitude of the peak (filled circles) and plateau (open circles) potentials were plotted against the intensity of the injected current. The straight line was extrapolated from the relation between the hyperpolarizing currents and the responses (broken line). Deviation from the straight line was observed for large current injection (arrows). B, Membrane potential changes induced by current injection in the presence of Co2+. Data were obtained from the same cell shown in A.

