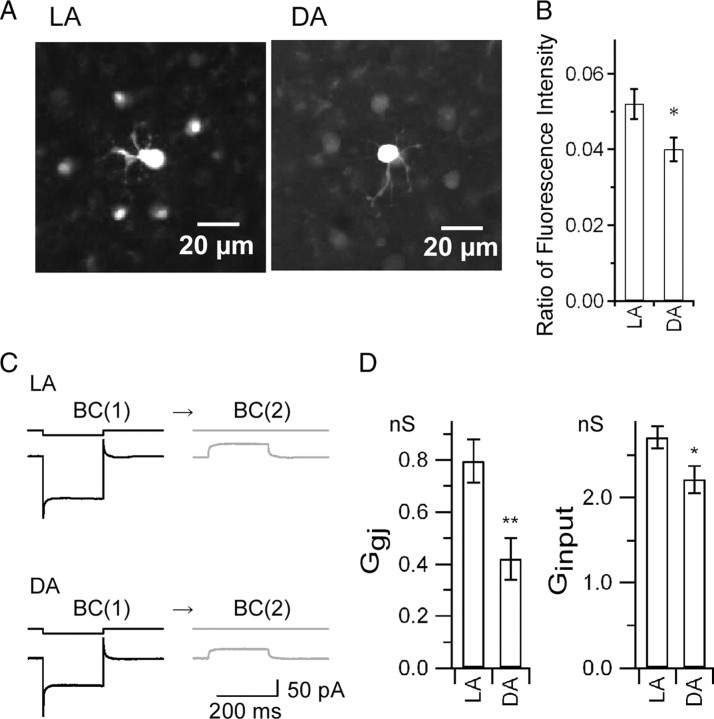
Figure 5.
Effects of light adaptation. A, B, Tracer coupling. A, Fluorescence images of tracer coupling among Mb1-BCs. Neurobiotin was introduced through a recording pipette into the axon terminal of a single Mb1-BC in the LA (left) or DA (right) whole-mount preparation. Focus was at the level of inner nuclear layer. B, Ratio of the fluorescence intensity, defined by the equation (Fs − Fback)/(Fc − Fback), where Fs, Fc, and Fback are the averaged intensity of the surrounding somata, the intensity of the tracer-injected soma, and the averaged intensity of the background, respectively. LA, n = 11 (data from 39 surrounding somata and 11 injected somata). DA, n = 8 (data from 37 surrounding somata and 8 injected somata). p < 0.05, unpaired t test. C, D, Electrical coupling under LA and DA conditions. C, Hyperpolarizing voltage pulse from −60 to −100 mV was applied to the BC(1) and the current responses were recorded from the BC(1) and the BC(2) in the slice preparation. D, Left, Pooled data of Ggj. LA, 0.80 ± 0.084 nS (n = 16). DA, 0.42 ± 0.081 nS (n = 9). p < 0.01, unpaired t test. Right, Pooled data of Ginput. Ginput was obtained from the current response of the BC(1) to hyperpolarizing voltage pulse from −60 to −100 mV. LA, 2.7 ± 0.13 nS (n = 18). DA, 2.2 ± 0.16 nS (n = 32). p < 0.05, unpaired t test.

