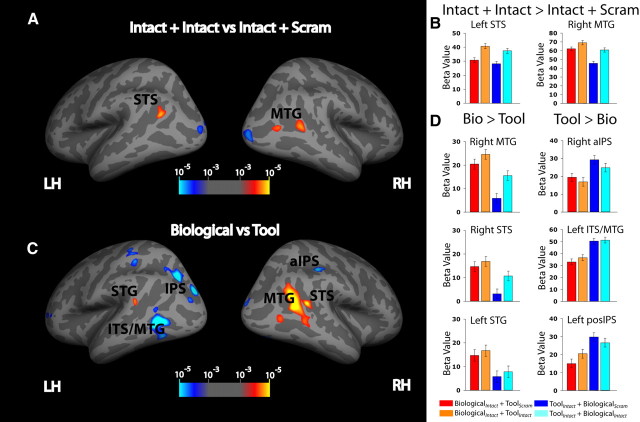
Figure 2.
fMRI results. A, Displayed are statistical maps of the attention (Intact plus Intact vs Intact plus Scram) main effect projected onto the inflated surface of the FreeSurfer fsaverage brain. Color coding represents −log10 (p) thresholded at p < 0.001 uncorrected; cluster p < 0.05 corrected. B, Plots of beta values for each of the four experimental conditions within a 4 mm radius circular ROI surrounding the local maxima for significant regions. Error bars represent the within-subjects confidence interval. C, D, Main effect of motion category. Bio, Biological; LH left hemisphere, RH, right hemisphere posIPS, posterior IPS.

