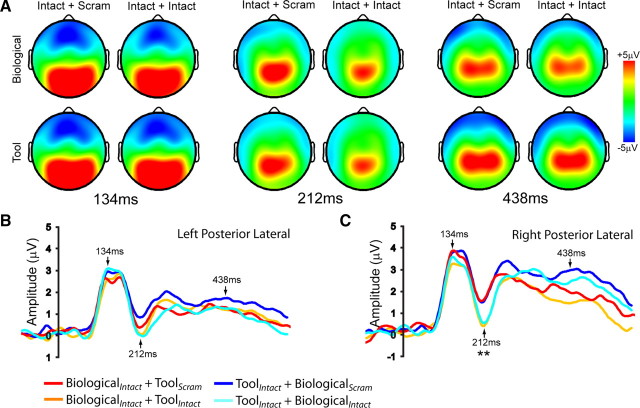
Figure 3.
Sensor-space analysis of ERPs. A, Topographic maps of the four conditions at time points corresponding to the P1 peak latency (134 ms), the N1 peak latency (212 ms), and a later time point (438 ms). B, Plots display the grand mean average ERPs following stimulus onset from the right and left posterior lateral electrode groups.

