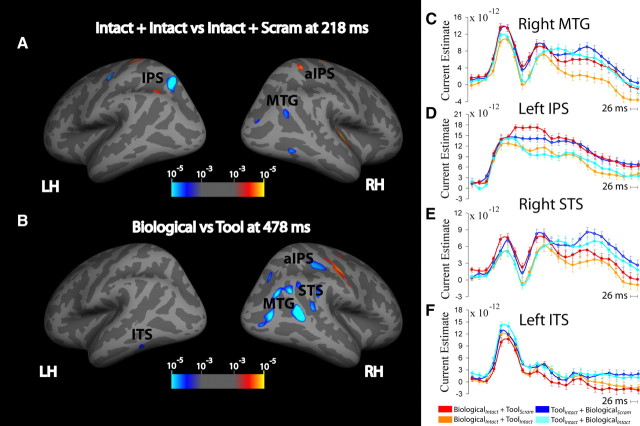
Figure 4.
Cortically constrained current source density analysis of attention condition and motion category main effects. A and B, Attention effects (A) and motion category effects (B) are displayed. Statistical maps of the between-condition difference in estimated current are displayed on inflated fsaverage surfaces. Color coding represents statistical significance [−log10 (p)] of these differences thresholded at p < 0.001 uncorrected; cluster p < 0.05 corrected. C–F, Time courses of CCSD estimates from each of the four conditions within a 4 mm radius circular ROI surrounding the local maxima for significant regions are shown. Error bars represent the with-in subject confidence interval. The online supplemental material includes time courses for additional regions (supplemental Figure S3, available at www.jneurosci.org as supplemental material) and the CCSD for each of the four conditions at the time points of significant effects (supplemental Figure S2, available at www.jneurosci.org as supplemental material). LH, Left hemisphere; RH, right hemisphere.

