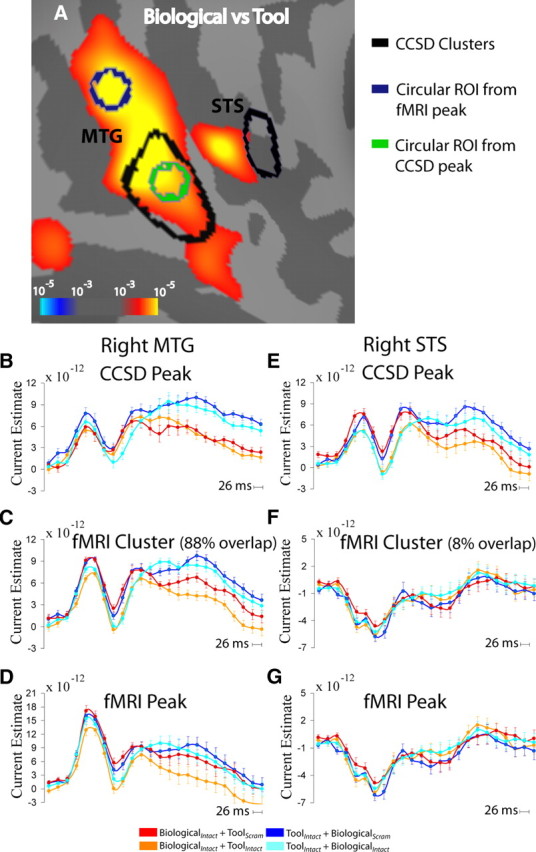
Figure 5.

Overlap of fMRI and CCSD regions. A, fMRI activation in the lateral temporal cortex for motion category (Biological vs Tool) comparison with CCSD clusters from the same comparison outlined in black. Circular ROIs of 4 mm radius were created surrounding the local maxima and are shown in green (CCSD) and navy blue (fMRI). B–G, Time course of CCSD estimates from each of the four conditions within CCSD peak (4 mm radius circular ROI) (B, E), fMRI cluster (C, F), and fMRI peak (D, G) for right MTG (B–D) and right STS (E–G).
