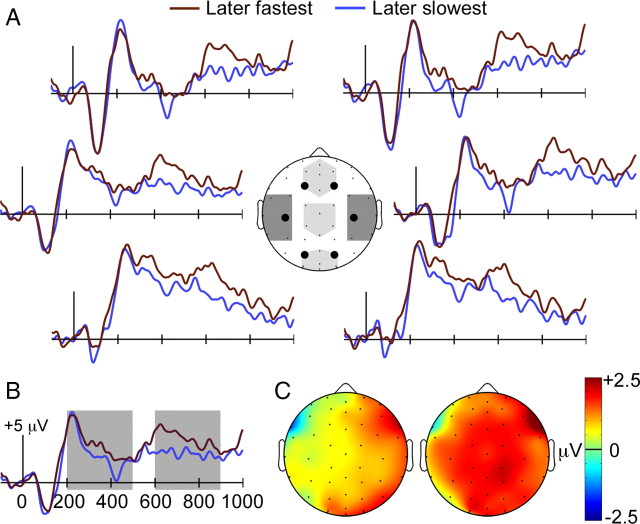
Figure 5.
Priming Dm effects. A, ERPs during study are shown for items that subsequently elicited the fastest responses during the priming test and for items that subsequently elicited the slowest responses. Light shading on the head diagram indicates the three midline clusters used for statistical analyses, and dark shading indicates the two lateral clusters (left and right). B, ERPs are shown averaged for all recording sites, and shading indicates the 200–500 ms and 600–800 ms latency intervals used for statistical assessment. C, Topography of ERP difference for later-fastest versus later-slowest conditions is plotted for the same two latency intervals, 200–500 ms at left and 600–800 ms at right.

