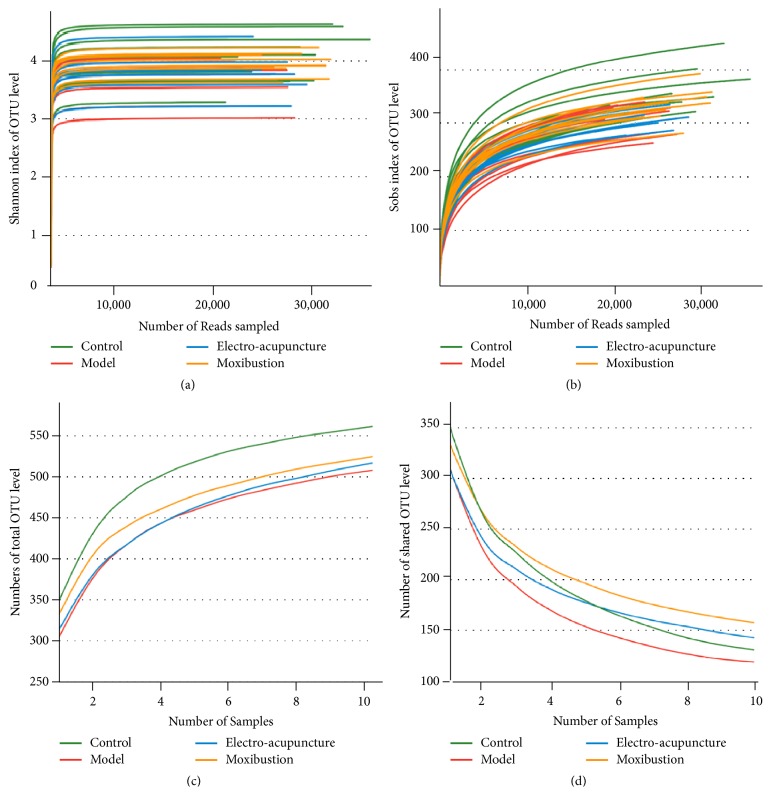
Figure 2.
Evaluation of sequenced data from fecal samples. (a) is rarefaction curves calculated from the flora sequenced data using Shannon index of OTU level; (b) is rarefaction curves calculated from the flora sequenced data using Sobs index of OTU level; (c) is Pan species of intestinal flora in each group on the OTU level; (d) is core species of intestinal flora in each group on the OTU level. The number of samples is 10 in each group.

