
Figure 1.
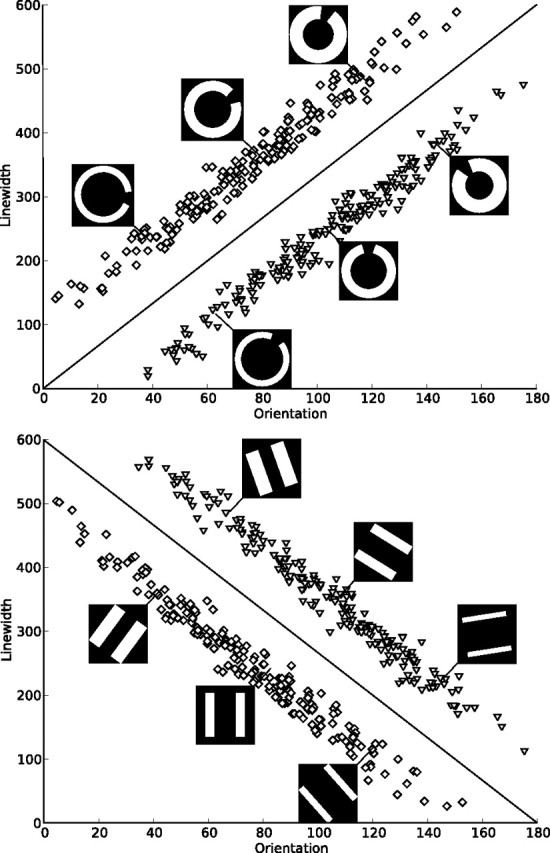
Category structures and sample stimuli. Each square denotes the orientation and line width of a stimulus from category A, and each triangle denotes those of a stimulus from category B. The lines represent the optimal decision bound. Two types of category structures were presented, one with a positive slope of the optimal decision bound and one with a negative slope. For both types of stimuli used in the experiment (circles and lines), examples of three stimuli from each category are shown. Both types of stimuli were used with both types of decision bounds. Note that 0° does not correspond to a horizontal alignment of the stimuli to make the verbalization of a categorization rule more difficult.