
Figure 3.
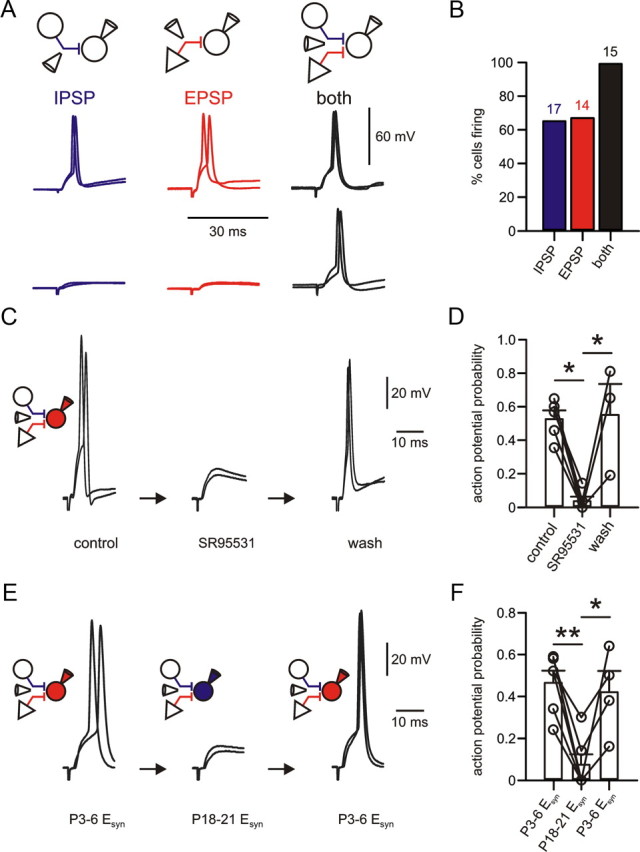
Depolarizing GABAergic signaling facilitates action potential generation in early postnatal perisomatic-targeting cells. A, Top, Schematic illustration of the experimental configuration. Bottom, Two examples are shown for extracellular activation of presynaptic GABAergic fibers (blue) in the presence of 4 mm kynurenic acid, of glutamatergic fibers (red) in the presence of 5 μm SR95531, or both GABAergic and glutamatergic fibers (black) in P3–P6 perisomatic-targeting cells (Vhold = Vrest). Two traces are superimposed. Recordings were performed with a pipette solution mimicking the native internal Cl− concentration at P3–P6 (“early postnatal Esyn” solution) estimated from perforated-patch recordings (Fig. 2). B, Bar graph summarizing the percentage of perisomatic-targeting cells discharging upon stimulation of pharmacologically isolated GABAergic, glutamatergic, or both types of presynaptic inputs (values above bars represent number of cells). C, Extracellular stimulation intensity was chosen to evoke action potentials in early postnatal perisomatic-targeting cells with ∼50% reliability (Vhold = Vrest; 2 superimposed traces). Middle, Blocking GABAA-mediated signaling with 5 μm SR95531 obstructs action potential generation. Right, Blocking effect on spike induction is reversed after washout of SR95531. D, Summary of the effect of SR95531 on discharge probability in early postnatal (P3–P6) perisomatic-targeting cells. Circles connected by lines represent single experiments (control 53 ± 5%, 5 cells; SR95531 4 ± 3%, 5 cells; wash 55 ± 19%, 3 cells). E, Left, Example of action potential initiation during recording with “early postnatal (P3–P6) Esyn” pipette solution as in C. Middle, Repatching the same cell with “juvenile (P18–P21) Esyn” pipette solution that induces shunting inhibition abolishes action potential generation. Right, Re-repatching the neuron with the initial P3–P6 Esyn pipette solution restores spiking. F, Bar graph summarizing discharge-probability in the experiments shown in E. *p < 0.05; **p < 0.01.