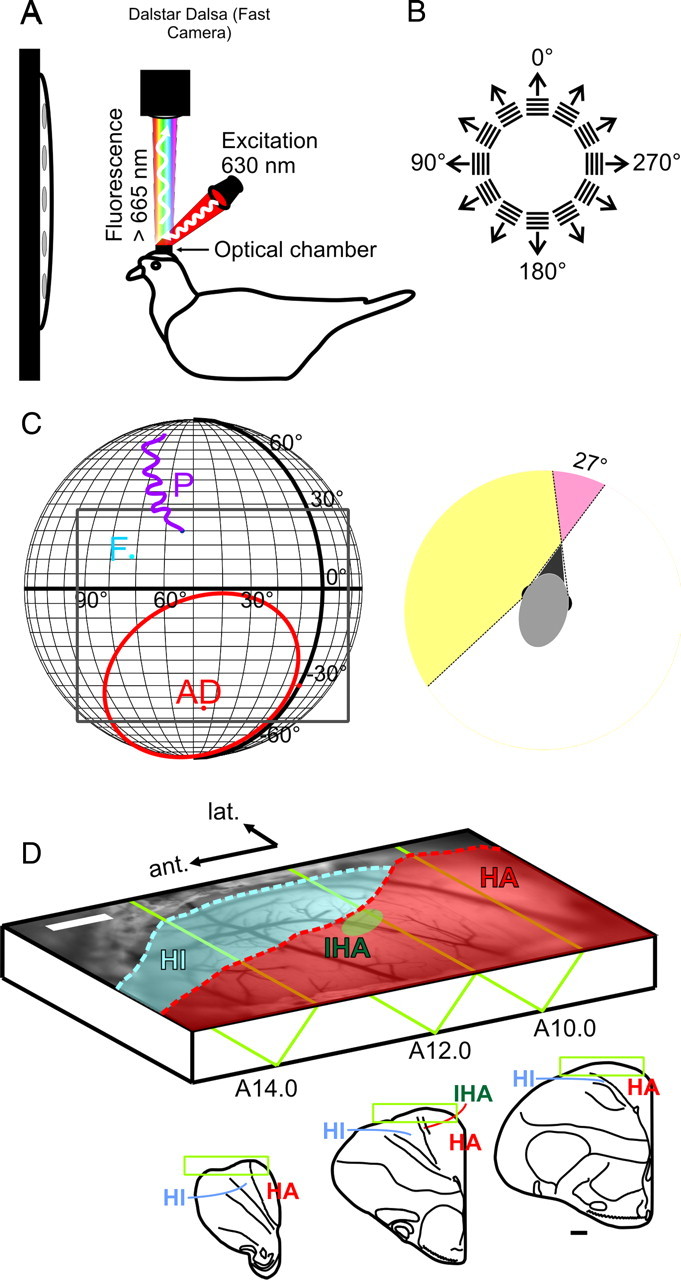
Figure 1.

VSD imaging in the pigeon visual Wulst in vivo. A, Schematic of the experimental setup. Anesthetized and paralyzed pigeons were head-fixed via a sealed custom optical chamber. Epifluorescent signals arising from the VSD-stained visual Wulst were captured by a fast CCD camera operating at 200 Hz. B, Activity was evoked using sinusoidal and square wave gratings at various spatiotemporal frequencies in 30° steps. C, Left, Visual features of the retina mapped onto real-world coordinates. The pigeon retina contains two local photoreceptor densities. The receptive field of area dorsalis (AD) or “red” field is frontal and ventral (red contour), and photoreceptors project mainly into the tectofugal system. The foveal pit (F) resides in the “yellow” field. This region receives visual input mostly from the lateral visual field and projects into the thalamofugal pathway. The pecten (P) is a large vascular structure of unknown function but served in this study as a retinal landmark for controlling eye movements and placement of visual stimulus. Gratings were presented on a flat screen monitor covering ∼120 × 80° of the visual field (gray rectangle). Right, The pigeon's visual field is highly lateralized with a dominantly monocular visual field spanning 169°. Compared with the owl, its binocular overlap is minimal (27°). D, Vascular map of the exposed Wulst region used for targeted electrode penetrations. The dura has been carefully resected. The schematic also presents the imaging position in which the brain was rotated 45° upward from the standard stereotactic position. Outsets show stereotactic slices (Karten and Hodos, 1967). Contours approximate regions where HA (red) and HI (blue) extrude the brain surface. The surface position of the input pseudolamina, IHA (A12.0; green ellipse), was inferred from the study by Karten et al. (1973). Scale bars (white and black), 1 mm.
