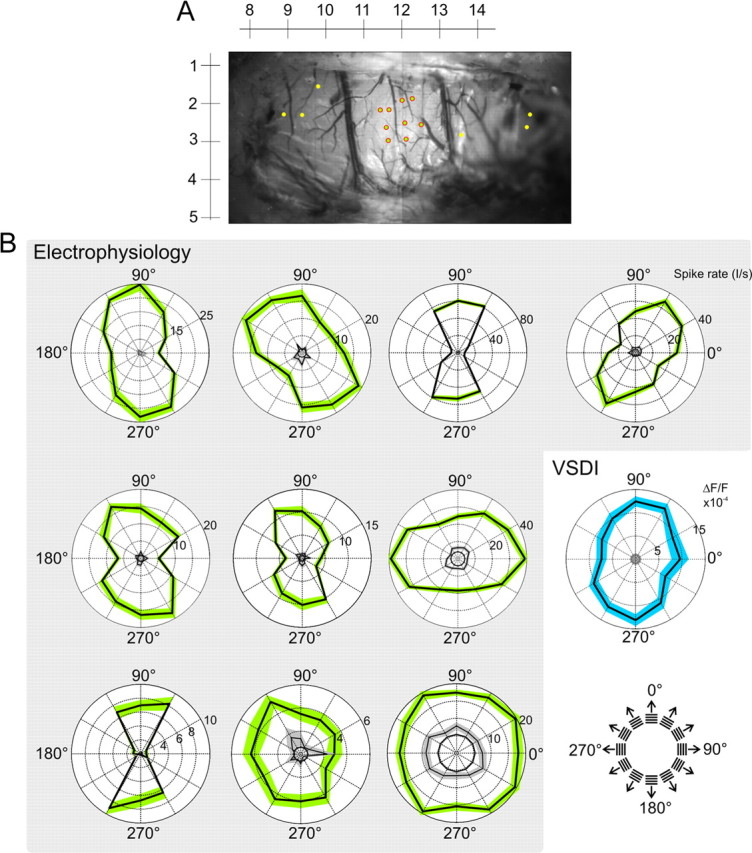
Figure 8.

Single-cell and population orientation tuning. A, Majority of spiking units were found within a small locality of the visual Wulst. An example of penetration sites is shown here for one subject. The yellow markers are penetration sites where cells that are well driven by grating stimulation were not found. The rulers correspond to stereotactic coordinates. B, Polar plots each represent the firing rate at a single recording site (green patches indicate ±SE). Frequency responses were averaged across 20–420 ms after stimulus onset. The black circles indicate mean activity in response to the blank stimuli and the inner black curves with surrounding gray patches (±SE) show “frame zero” activity (firing rate averaged over 220 to 20 ms before the stimulus onset). Individual tuning widths were estimated using a Gaussian model; σ of these fits (from left to right, top to bottom) were as follows: 41, 56, 42, 38, 52, 48, 32, 38, 73°, ∞. For all 124 cells, the median σ was 47°, with the 25th and 75th percentile bounds at 39–57°. The blue polar plot is derived from VSD imaging for comparison. It depicts the ΔF/F in response to six grating orientations. The dye signal was averaged over the “input region” (Fig. 2; supplemental Figs. 1, 3, available at www.jneurosci.org as supplemental material), across 20–420 ms after stimulus onset. The gray circle inside this plot represents mean activity (±SE) in response to the blank stimuli. A Gaussian fit of this plot gives a σ of 45°. The median σ across experiments was 62°, with the 25th and 75th percentile bounds at 48–91°.
