
Figure 2.
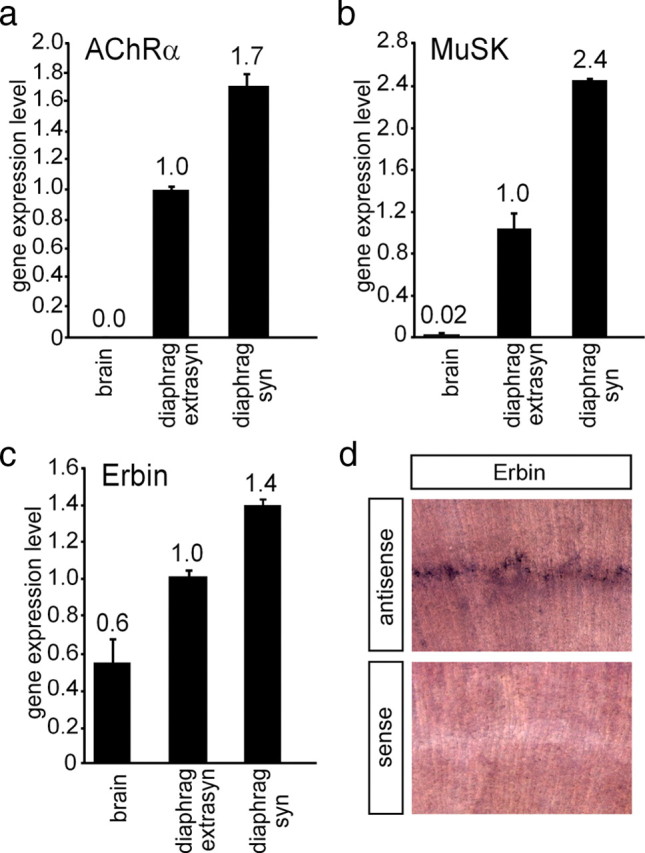
Distribution of AChRα, MuSK, and Erbin in muscle cells. The distribution of different transcripts was followed by quantitative RT-PCR in brain (used as control) and extrasynaptic and synaptic regions of diaphragm. Results are presented as graphs. a, b, AChRα and MuSK were used as controls, because their transcript levels are known to be enriched at synaptic sites of diaphragms. c, Erbin is also transcribed at a higher rate at synaptic sites of the diaphragm. Quantitative RT-PCR data were normalized to β-actin. Transcript levels in extrasynaptic parts of the diaphragm were set to 1. d, Images present diaphragm tissue of a wild-type mouse 6 d after birth stained by in situ hybridization using an antisense or a sense Erbin riboprobe, as indicated.