Figure 6.
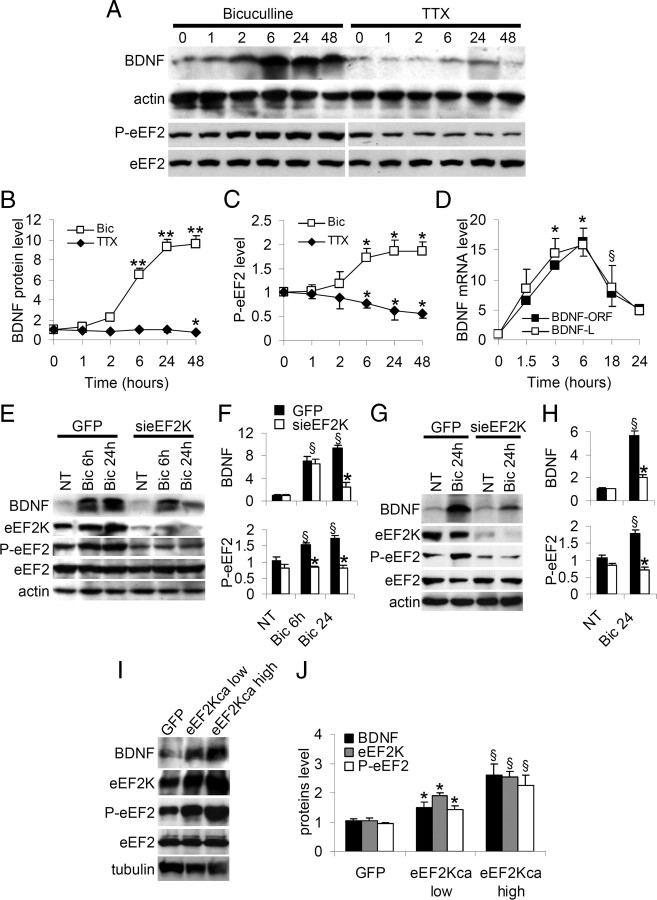
Neuronal activity modulates BDNF protein and transcripts in a biphasic manner, through the eEF2-eEF2K pathway. A, Neurons were treated with TTX or bicuculline for up to 48 h, solubilized in SDS sample buffer, and levels of BDNF, P-eEF2 and total eEF2 analyzed by Western blot. B, Mean BDNF levels (error bars SEM) normalized against actin are shown as fold increases relative to time 0; *p < 0.05 versus untreated neurons; **p < 0.01 versus untreated neurons (ANOVA, Tukey test, n = 6). C, Mean P-eEF2 levels (error bars SEM) normalized against actin and shown as fold increase relative to time 0; *p < 0.05 versus untreated neurons (ANOVA, Tukey test, n = 6). D, Whole-cell levels of BDNF-ORF and BDNF-L mRNA were measured by RT-quantitative PCR after bicuculline treatment. Transcripts increased during the first 6 h of bicuculline stimulation but decreased subsequently (fold expression relative to untreated neurons normalized against actin mRNA: 1.5 h = 7.5 ± 0.60, 3 h = 12.5 ± 0.32, 6 h = 16.3 ± 2.32 for BDNF-ORF; 1.5 h = 8.6 ± 3.20, 3 h = 14.4 ± 2.57, 6 h = 15.9 ± 2.76 for BDNF-L, 18 h = 7.8 ± 2.09; 24 h = 5.2 ± 0.71 for BDNF-ORF; 18 h = 8.6 ± 3.70; 24 h = 4.8 ± 0.35 for BDNF-L), *p < 0.01 versus time 0, §p < 0.05 versus time 6 h. (ANOVA, Tukey test, n = 7). E, Neurons were infected with sieEF2K lentivirus or control virus on DIV8, treated as shown, and BDNF, eEF2K, P-eEF2 and eEF2 levels analyzed by Western blot. F, BDNF and P-eEF2 levels (error bars SEM) after treatments in neurons infected with GFP virus or sieEF2K virus (n = 7) (P-eFF2 levels normalized against total eEF2: NT+GFP 1.0 ± 0.09; Bic 6 h+GFP 1.5 ± 0.07; Bic 24 h+GFP 1.7 ± 0.09; NT+sieEF2K 0.8 ± 0.09; Bic 6 h+ sieEF2K 0.8 ± 0.07; Bic 24 h+ sieEF2K 0.8 ± 0.10; BDNF levels normalized against actin: NT+GFP 1.0 ± 0.10; Bic 6 h+GFP 7.1 ± 0.76; Bic 24 h+GFP 9.4 ± 0.57; NT+sieEF2K 1.0 ± 0.09; Bic 6 h+ sieEF2K 6.5 ± 0.90; Bic 24 h+sieEF2K 2.5 ± 0.77). *p < 0.05 versus GFP-infected neurons, §p < 0.01 versus untreated neurons. G, Hippocampal slices were infected with sieEF2K lentivirus or control virus on DIV8, treated as shown, and BDNF, eEF2K, P-eEF2 and eEF2 levels determined by Western blot. H, BDNF and P-eEF2 levels (error bars SEM) after the treatment of hippocampal slices infected with GFP virus or sieEF2K virus (n = 7) (BDNF, NT+GFP 1.0 ± 0.12, Bic 24 h+GFP 5.6 ± 0.41, NT+sieEF2K 1.0 ± 0.02, Bic 24 h+sieEF2K 2.1 ± 0.19; P-eEF2, NT+GFP 1.0 ± 0.09; Bic 24 h+GFP 1.8 ± 0.10; NT+sieEF2K 0.8 ± 0.09; Bic 24 h+ sieEF2K 0.7 ± 0.07). *p < 0.01 versus GFP-infected neurons, same treatment; §p < 0.05 versus untreated neurons same transfection (ANOVA, Tukey test). I, Neurons were infected with low and high titer lentivirus preparations expressing eEF2Kca and BDNF; eEF2K, P-eEF2 and eEF2 levels were determined by Western blot. J, BDNF, eEF2K and P-eEF2 levels (error bars SEM) after infection (n = 5) (BDNF: GFP = 1.0 ± 0.80, eEF2Kca low = 1.5 ± 0.20, eEF2Kca high = 2.6 ± 0.36; eEF2K: GFP = 1.0 ± 0.12, eEF2Kca low = 1.9 ± 0.09, eEF2Kca high = 2.5 ± 0.20; P-eEF2: GFP = 0.9 ± 0.05, eEF2Kca low = 1.4 ± 0.11, eEF2Kca high = 2.2 ± 0.35). *p < 0.05 versus GFP-infected neurons, §p < 0.01 versus GFP-infected.

