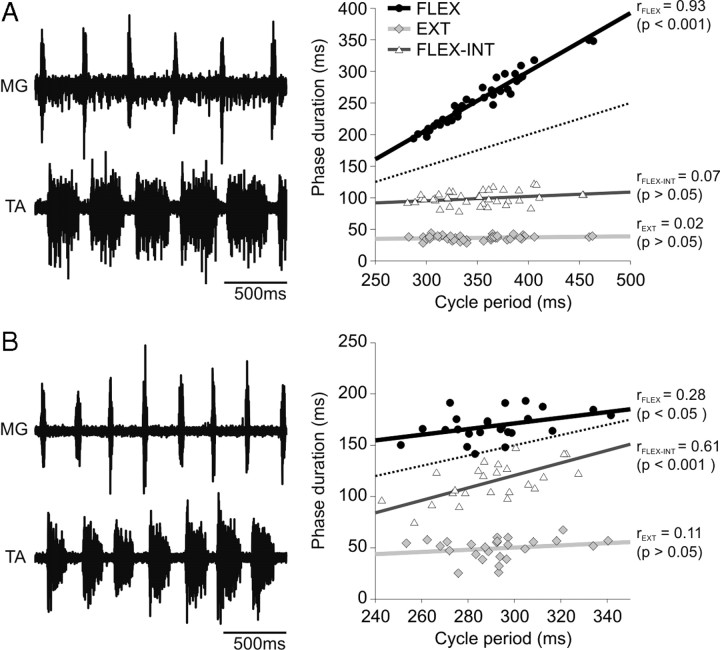
Figure 2.
Phase/cycle period relationships during fictive scratching in the decerebrate cat. Left panels show ENG from extensor (MG) and flexor (TA) nerves during flexor-dominated (A) and non-flexor-dominated (B) fictive scratching episodes in 2 cats. Right panels show scatter plots and regression lines for flexion (black circles), extension (gray diamonds), and flexion-interval (white triangles) phase durations expressed relative to the corresponding cycle period. The dotted line has a slope of 0.5 and passes through the origin and is used as a reference line.

