Figure 1.
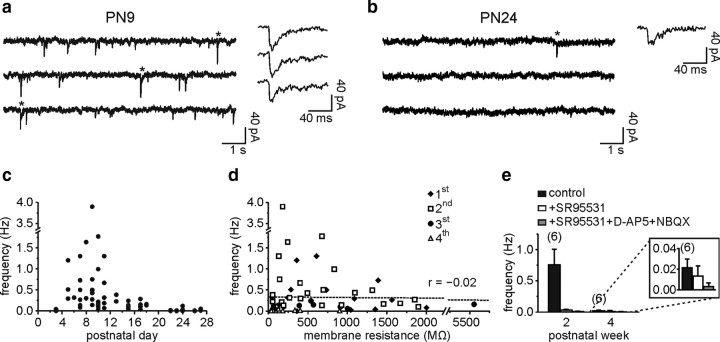
Decrease of spontaneous synaptic activity of NG2 cells during postnatal development. a and b, Spontaneous synaptic currents of two NG2 cells held at −90 mV at PN9 (a) and PN24 (b). Note the fast rise times of individual currents at both ages (<2.1 ms). c, Plot of spontaneous synaptic current frequency against PN day. d, Plot of synaptic current frequency against cell membrane resistance. There was not a significant correlation between these two parameters (r = −0.02; p > 0.05). Each cell is marked with a different symbol according to its PN week. e, Histogram of spontaneous synaptic current frequency in control, after bath application of 5 μm SR95531, and after a further addition of 50 μm d-AP-5 and 10 μm NBQX for the second and fourth PN weeks. Note the absence of block by 5 μm SR95531 in the fourth PN week (inset).

