Figure 4.
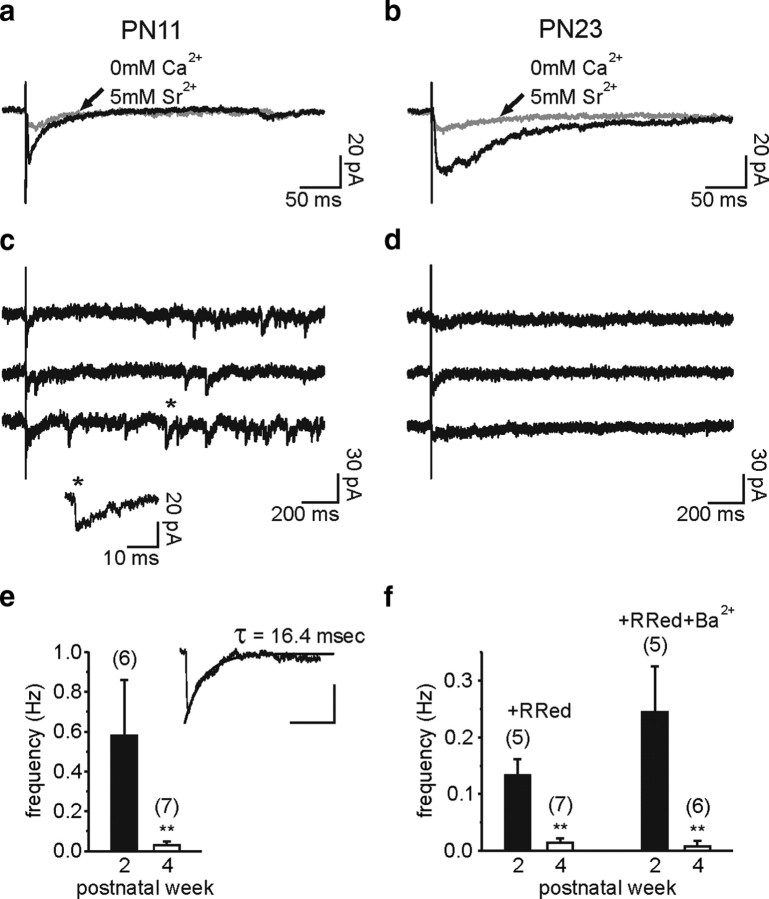
Miniature GABAergic synaptic currents of NG2 cells dramatically decrease during development. a and b, Averaged traces of evoked currents of two NG2 cells held at −70 mV at PN11 (a) and PN23 (b) in control (black) and when 2 mm Ca2+ was replaced by 5 mm Sr2+ (gray). In these experiments, 10 μm NBQX and 50 μm d-AP-5 were added in the perfusate. Note that currents were strongly decreased in the presence of Sr2+ at both developmental stages. c and d, Single traces of evoked currents of the same NG2 cells. Note the presence of miniature events with fast rise times at PN11 (c), but not at PN23 (d). e, Histogram of the frequency of the evoked miniature events in Sr2+ for cells in the second and fourth PN weeks. The inset illustrates the average of 25 evoked miniature currents of a NG2 cell at PN11 fitted by a single exponential. Scale bars, 10 pA and 40 ms. f, Histograms of the frequency of the miniature events in the presence of 75 μm ruthenium red (R Red) and 75 μm ruthenium red plus 1 mm Ba2+ for cells in the second and fourth PN weeks. In these experiments, 0.5 μm TTX, 10 μm NBQX, and 50 μm d-AP-5 were also added in the perfusate.

