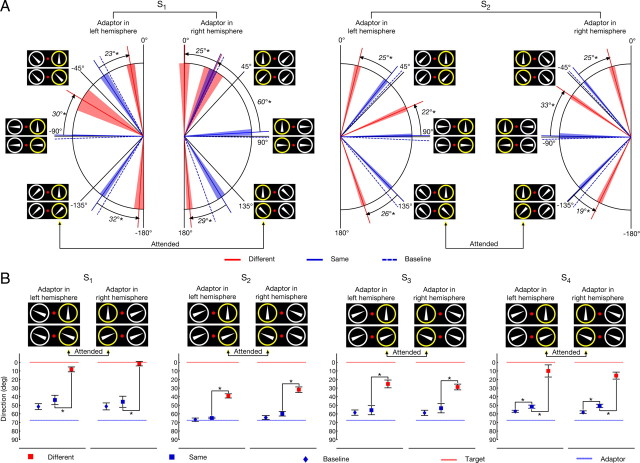
Figure 2.
Dependency of the SMAE on the similarity of the attended stimulus and the adaptor. A, Perceived direction of SMAE for two subjects for six adaptor directions (−135°, −90°, −45°, 45°, 90°, 135°). For S1, the adaptor was always directed outward with respect to the fovea, and for S2, it was always directed inward. The panel at each of the six adaptor directions indicates the presented motion directions in the same- and different-conditions. Mean baselines for each direction are indicated by the dashed blue lines. Mean SMAEs from same-trials are indicated by the solid blue lines. Mean SMAEs of different-trials are indicated by the red lines. For better readability, the indicated SMAEs are transformed to the direction of motion that would have caused them, assuming a simple reversal (Fig. 1A). The colored region around the respective means represents 95% confidence intervals. Arrows denote the differences between the same-condition and the different-condition. Asterisks indicate statistical significance. Yellow circles denote the attended target RDK. B, Results for all subjects (−67.5°, 67.5°). For S1, the adaptor was always directed outward. For all other subjects, it was directed inward. Mean SMAEs of different-conditions are indicated by red squares. Mean SMAEs of same-conditions are indicated by blue squares, and mean baselines are indicated by blue diamonds. SMAEs are shown as the unsigned direction that would have caused them. Dashed blue lines indicate the unsigned adaptor direction, and dashed red lines indicate the attended direction. Error bars denote 95% confidence intervals.

