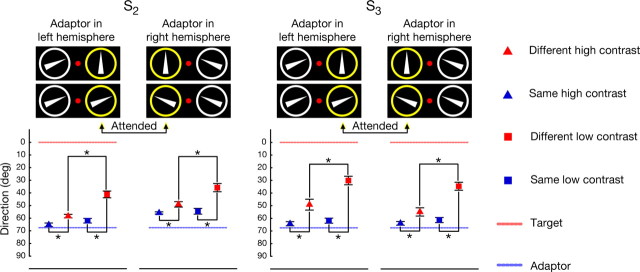
Figure 3.
Contrast dependency of the SMAE. For both subjects the adaptor (−67.5°, 67.5°) was always directed inward with respect to the fovea. For the high-contrast condition, mean SMAEs of different-conditions are indicated by red triangles and mean SMAEs of same-conditions are indicated by blue triangles. For the low-contrast condition, mean SMAEs of different-conditions are indicated by red squares and mean SMAEs of same-conditions are indicated by blue squares. Dashed blue lines indicate the unsigned adaptor direction, and dashed red lines indicate the attended direction. Error bars denote 95% confidence intervals. For both subjects, differences between the same-condition and the different-condition are statistically significant in the high- and low-contrast conditions as indicated by asterisks. The low-contrast condition results in a significantly stronger attraction than the high-contrast condition.

