Figure 1.
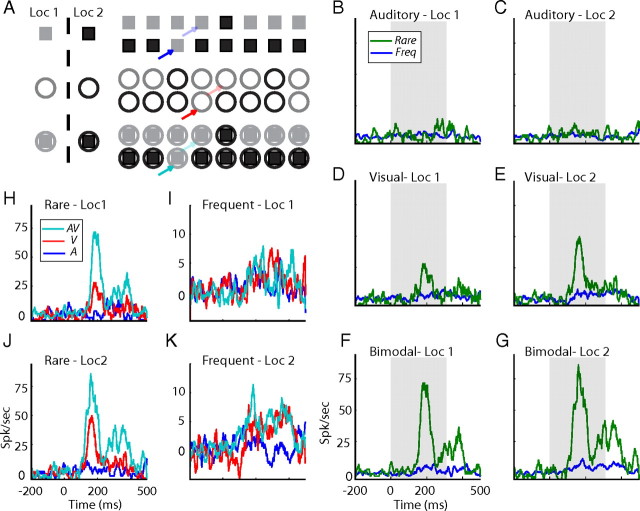
Comparison between responses to rare and frequent presentations. A, Outline of the bimodal oddball test. Each line represents a sample sequence from a single oddball block. Squares designate the auditory stimuli, circles designate the visual stimuli, and filled squares designate the bimodal stimuli. Gray filled shapes specify the peripheral position (Loc 1), and black shapes specify the central position (Loc 2). Bold arrows point to examples of rare occurrences of auditory (blue), visual (red), and bimodal (cyan) stimuli. Light arrows point to corresponding examples of frequent occurrences. B–G, PSTHs of responses to rare occurrences (green lines) are shown together with the corresponding responses to frequent occurrences (blue lines). Responses to the two auditory stimuli are shown in B,C, the two visual stimuli in D,E, and the two bimodal stimuli in F,G. Results from stimuli at the peripheral location are presented on the left, and results from stimuli at the center are presented on the right. Gray filled squares mark stimulus onset and duration. H–K, The PSTHs of responses to the two bimodal stimuli (cyan lines) are overlaid with the PSTHs of responses to their visual (red) and auditory (blue) components. Comparison is performed twice, once for rare occurrences (H, J) and once for frequent occurrences (I, K).

