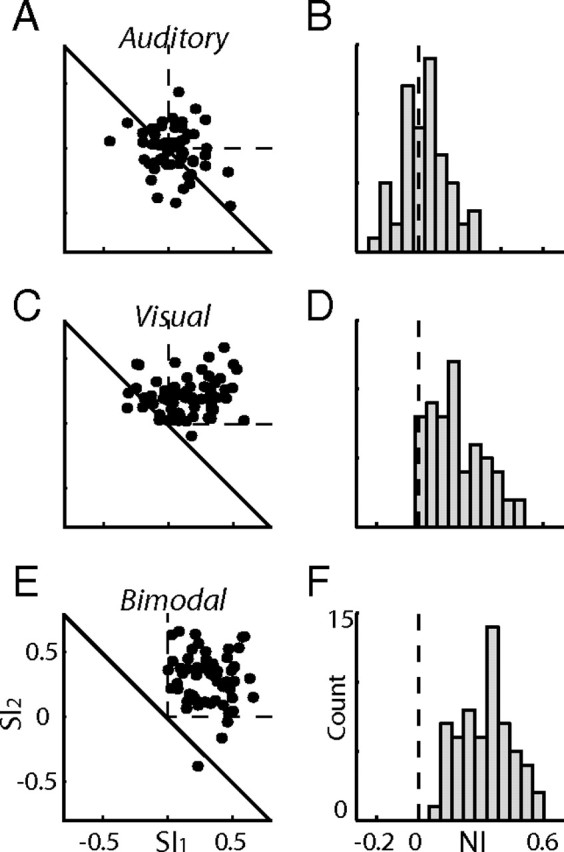
Figure 2.

Summary of results from all recording sites. A, A scatter plot showing SI1 versus SI2 measured from the responses to the auditory sequences. The dashed lines mark the first quadrant, in which both SIs are positive. The diagonal line marks the nonspecific adaptation line (see Results). B, A histogram showing the distribution of the NIs measured from all auditory oddball tests. The dashed vertical line indicates NI = 0. C, D, Results from all visual oddball tests. E, F, Results from all bimodal oddball tests. Format as in A and B.
