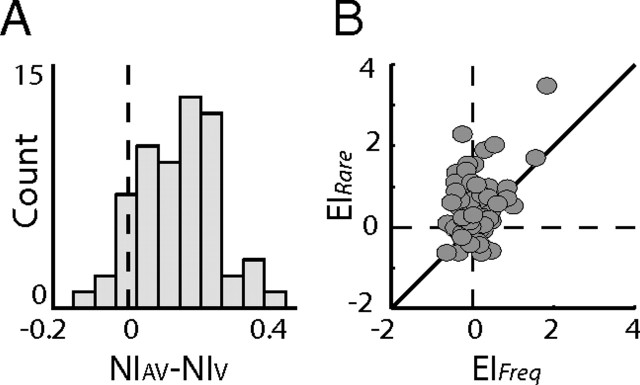
Figure 3.
Interaction between SSA and multisensory integration. A, The difference between the bimodal NI and the visual NI was measured for each site. The histogram shows the distribution of all differences. B, Scatter plot of EIs measured from frequent occurrences (x-axis) versus the corresponding EIs measured from deviant occurrences (y-axis). The diagonal line shows the line of equality.

