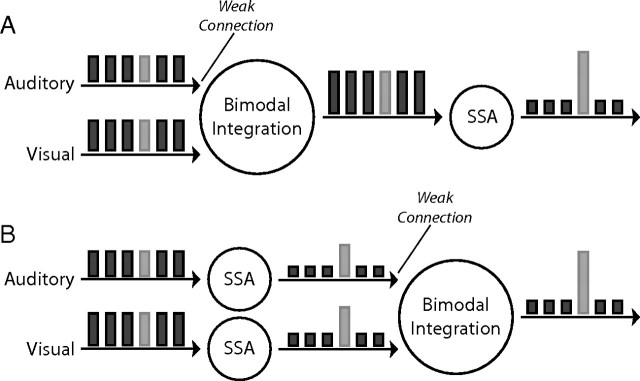
Figure 6.
Schematic representation of the two basic models. A, Visual and auditory inputs are integrated at the first stage. At a later stage, the bimodal responses undergo through an SSA filter. B, Each input channel, auditory or visual, is filtered separately through an SSA channel. The filtered responses are then fed to the multisensory integrator. The bars represent a sequence of frequent events (dark bars) with one rare event (light bar). The height of each bar represents the hypothetical responses at the various stages of the model.

