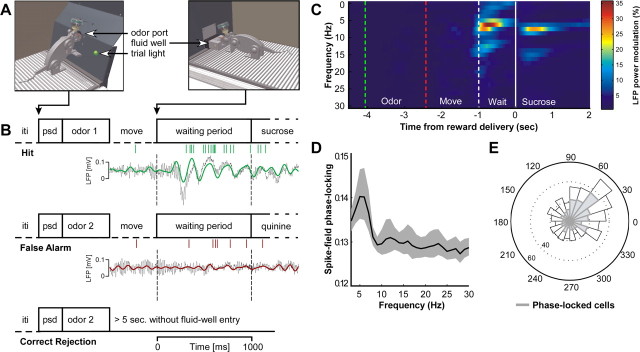
Figure 1.
Task-related theta oscillations and phase locking. A, Operant chamber; impression of rat making odor poke (left) and fluid poke (right). B, Raw LFP segments recorded during different task periods (black) and bandpass-filtered LFP (4–12 Hz) (green trace, hit trial; red, false alarm trial) and spike trains from one unit, recorded on a different tetrode (vertical green/red bars). psd, prestimulus delay. C, LFP power modulation, synchronized in time on sucrose delivery. Pseudocolors indicate averaged percentage increase in LFP power compared to the intertrial interval period. Green dashed line, Median time of odor onset; red dashed line, median time of odor offset; white dashed line, start of waiting period; white solid line, sucrose delivery. Theta oscillations (9 Hz) found during odor sampling are not visible here due to synchronization on reward delivery. D, Spike–field phase-locking spectrum averaged across all task-segments and all units. Shaded regions indicate 95% bootstrapped confidence intervals on the mean. E, Polar histogram of mean phase values for all cells. Shaded part corresponds to number of significantly phase-locked units (270 of 525, Rayleigh test, p < 0.05). Mean phase, 11.3°. Distribution of phases deviated significantly from uniform distribution (p < 0.001).

