
Figure 1.
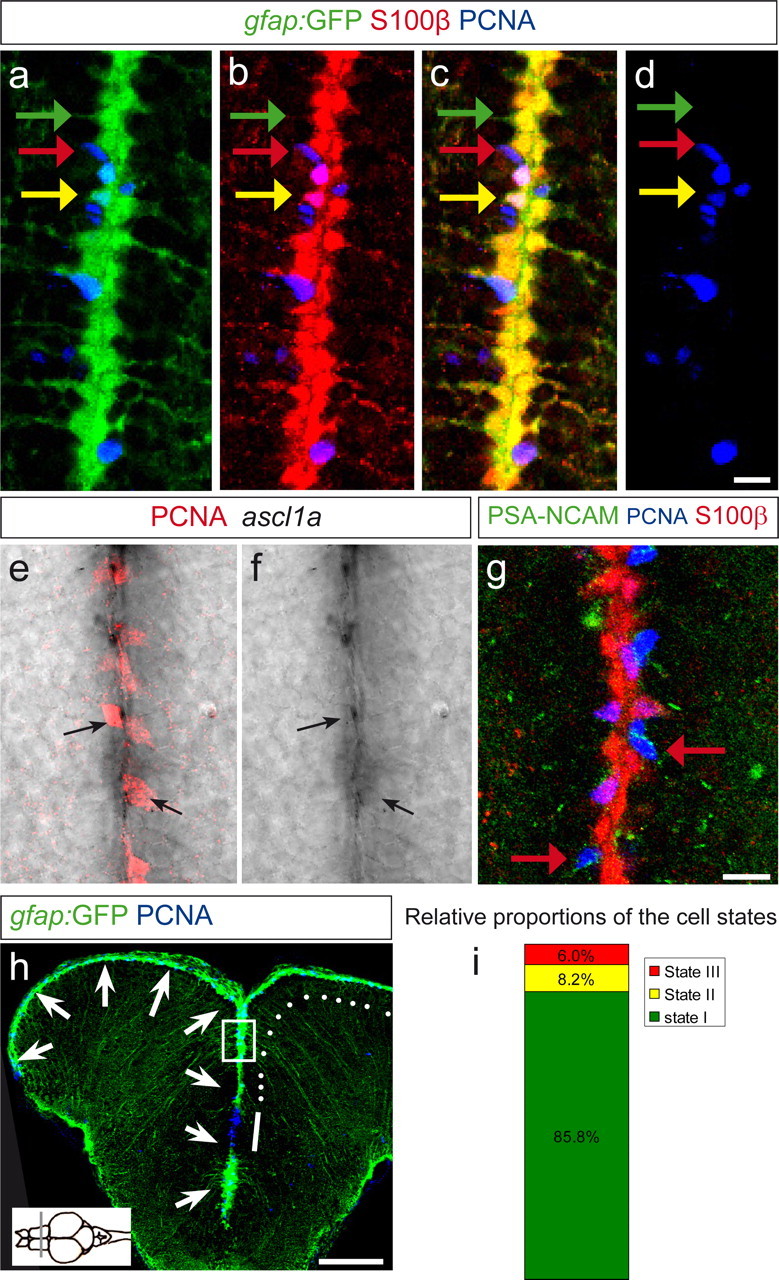
The telencephalon neurogenic zone contains three cell states. Telencephalic cross sections at the anteroposterior level indicated in the inset on the bottom left in h. a–d, Single optical section in a gfap:GFP transgenic brain section, immunostained for GFP (green), S100β (red), and PCNA (blue), depicting a close-up view on the ventricular surface at the midline between the two brain hemispheres. gfap:GFP and S100β are coexpressed in all radial glial cells (yellow in c). Three cell states are visible: the majority of radial glial cells are noncycling (PCNA-negative; green arrow, state I cells). Some radial glial cells are PCNA positive (yellow arrow, state II cells). Some cells express only PCNA and no radial glial marker (red arrow, state III cells). e–g, State III cells express markers of neuroblasts. e, f, Expression of ascl1a revealed by in situ hybridization (black signal), revealing colocalization with PCNA (red). g, PSA-NCAM antibody staining (green) labels many state III cells, as shown by red arrows, revealing their identity of migrating neuroblasts. h, Overview of a gfap:GFP telencephalic section in a confocal stack projection, stained for GFP (green) and PCNA (blue). The arrows depict the telencephalic ventricle, located at the surface and at the midline. The boxed area depicts the region shown in a–g. The white line depicts the pallial–subpallial border region, in which mostly state III cells are located. The white dots depict the pallial ventricular region in which states I, II, and III are intermingled. This latter region is quantified in i and examined further in the next experiments. i, Relative proportions of state I, II, and III cells, counted in 2845 VZ cells of four brains. Scale bars: (in d) a–d, 10 μm; (in g) e–g, 10 μm; h, 100 μm.