
Figure 2.
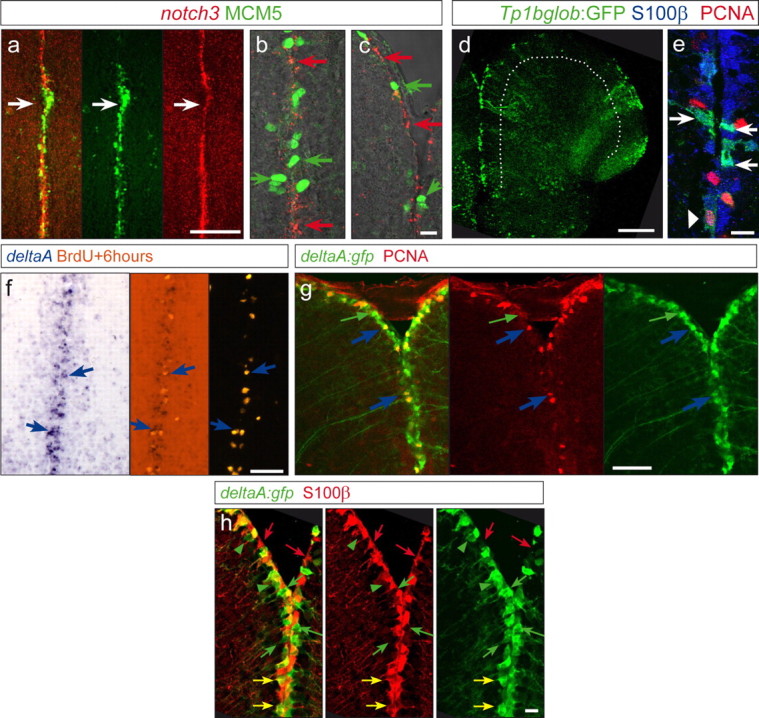
Expression of notch3 and the Notch reporter transgenic line highlight state I cells, whereas proliferating progenitors express deltaA. a–c, notch3a in situ hybridization (red signal) and MCM5 (green, proliferation marker) in the midline of the telencephalon showing a complementary expression: regions with dense expression of MCM5 express lower levels of notch3 (white arrow in a), and high magnifications (b, c) reveal a complementary expression at the single-cell level. d, Cross sections, as a projection of a confocal stack, of a TP1bglob:gfp transgenic telencephalon, highlighting activation of RBPJ targets/canonical Notch signaling (green) along the VZ (the VZ is underlined by the white dotted line). e, GFP-positive cells colocalize with S100β (blue). Only a few (6%) weak GFP-positive cells (arrowhead) colocalize with S100β/PCNA double-positive cells (PCNA in red). f, g, Dividing cells marked by a BrdU pulse 6 h before analysis (orange, f) or by PCNA (red, g) express the Notch-ligand DeltaA (blue arrows), as visible by in situ hybridization (f, blue signal) and in the deltaA:gfp transgenic line (g, green; 95% of the PCNA-positive cells are GFP positive). The green arrow in g depicts also deltaA:GFP cells that are PCNA negative (64% of the GFP-positive cells are PCNA negative). h, Expression of deltaA:GFP (green) compared with S100β-positive radial glia (red). Green arrows point to single GFP-positive cells, and red arrows point to cells expressing S100β only. The majority of labeled cells are double-positive cells and appear yellow in the first panel (yellow arrows, 75% of deltaA:GFP cells are S100β positive). Scale bars: a, d, 100 μm; c, e, h, 10 μm; f, g, 50 μm.