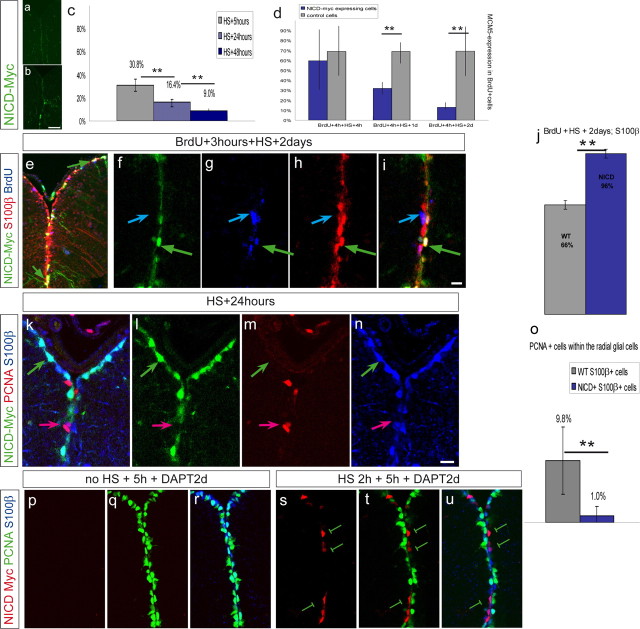
Figure 6.
NICD expression induces a switch from state II to state I. Double-transgenic fish carrying hsp70:gal4 and uas:nicd–myc were submitted to HS for 2.5 h at 38°C. Expression of NICD–Myc fusion protein is revealed by Myc antibody staining on telencephalic cross sections, as depicted in green (a–n) or red (p–u). a, b, Anti-Myc staining in a transgenic fish without HS (a) and with HS (b), indicating that the transgene is not or is only weakly expressed before HS. c, Fish were killed 5, 24, and 48 h after the end of the HS. The percentage of dividing cells (expressing MCM5) was calculated, in three independent experiments. The proportion of dividing cells significantly decreases with increasing time of NICD expression (n = 3 brains each with a total of 444, 1884, and 1540 counted cells for the respective time points; **p = 0.012, one-way ANOVA). d, In two independent experiments, BrdU was administered 3 h before HS to trace NICD–Myc-expressing (blue bars) and neighboring wild-type (gray bars) cells that had just divided. The proportion of such cells that remained positive for MCM5 was calculated. Control BrdU-labeled cells essentially remained MCM5-positive over 2 d, but NICD-expressing BrdU-labeled cells rapidly exited the cell cycle (5–11 sections per brain from 2 brains for each time point; significant decrease for the second and third time point, paired t test for repeated measurements, **p < 0.01). The three time points are significantly different from each other (interaction term in repeated measurement two-way ANOVA, p < 0.01). e–j, BrdU was administered 3 h before HS. At 2 d after HS, the proportion of BrdU-positive cells (blue) expressing S100β (red) within the NICD–Myc-positive population (green), quantified in i, is higher than within the neighboring control population. The green arrow in f–i depicts a Myc+ BrdU+ cell that is S100β positive, while the Myc-negative BrdU+ cell depicted by the blue arrow is S100β positive. j, Quantification (n = 4 sections, 178 Myc+S100β+ cells, 407 Myc(−)S100β+ cells, **p < 0.01, paired t test). k–o, One day after HS, the proportion of S100β+ (red), PCNA+ (blue) cells (state II cells) within the total S100β+ population was significantly decreased in the NICD-Myc+ (green) compared to the NICD-Myc-negative population (n = 2 brains, total of 572 Myc+ and 1701 Myc-negative cells counted in 11 sections, **p < 0.01, paired t test for repeated measurements). Scale bars: b, 50 μm; i, m, 10 μm. The error bars represent the SEM, with n = number of brains (c, d, o) or number of sections (j). p–u, NICD expression can rescue the effect of DAPT. Transgenic animals were subject to a 2 h HS (s–u) or no HS (p–r) followed by a 5 h pause and a 2 d DAPT treatment. The division status (PCNA expression, green) of Myc-negative radial glia (expressing S100β, blue) or Myc-positive radial glia (anti-Myc immunocytochemistry, red) was then assessed. Note that all Myc-positive glia are negative for PCNA (n = 113 Myc-positive cells counted out of 8 sections from three brains; some examples are indicated by the green bars). Hence, they fail to induce cell cycle upon DAPT treatment, in contrast to Myc-negative glia in non-heat-shocked (p–r) or heat-shocked (s–u) animals.

