
Figure 7.
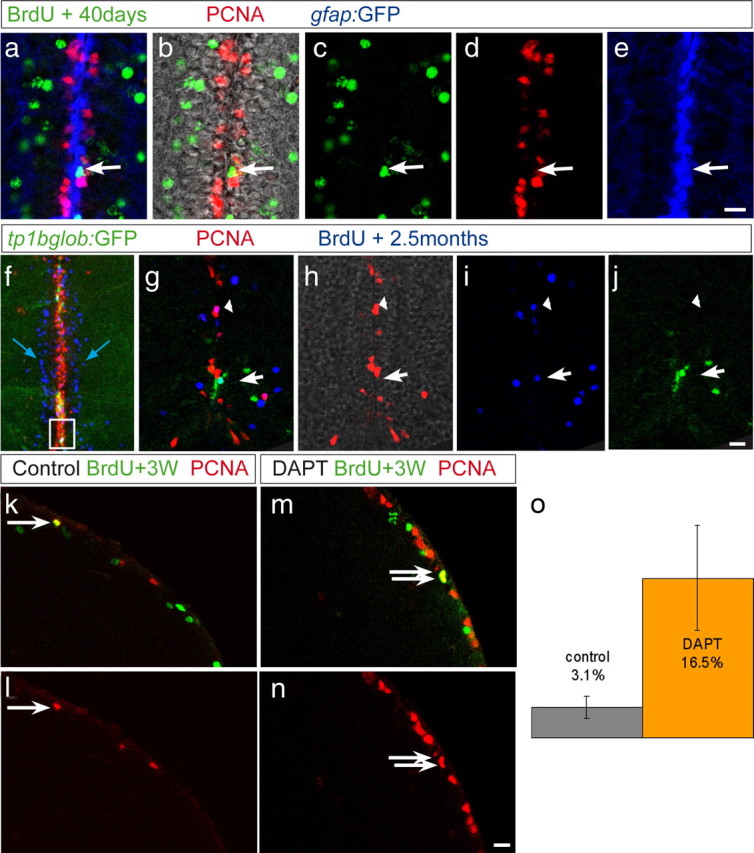
State II cells endogenously transit to state I and back to state II, according to Notch activity. a–e, Cross section of a gfap:GFP transgenic fish (GFP in blue) treated with BrdU for 5 d and killed 40 d after the last injection. Some BrdU-labeled cells (green) remain in the ventricular area but are PCNA (red) negative, as pointed to by the arrow, indicating that they have entered state I after having divided. f–j, TP1bglob:gfp transgenic fish treated with BrdU for 5 d and killed 2.5 months later. f, Projection of several confocal planes, overview of the telencephalic midline: Many BrdU+ cells (blue) have exited from the ventricular zone containing PCNA+ cells (red) and have entered the parenchyma (blue arrow). g–j, Single optical section showing the area boxed in f. Some BrdU+, PCNA-negative cells remaining in the ventricular area are GFP+ (white arrow), indicating that they have entered state I and are under high Notch signaling. k–o, WT fish were injected with BrdU for 5 d and treated 3 weeks later for 2 d with DAPT or control water. Brains were stained for BrdU (green) and PCNA (red). o, The proportion of BrdU+, PCNA+ cells within the ventricular BrdU+ population was calculated in two control and two DAPT-treated brains. After DAPT treatment, this proportion is increased by 5 times compared to the control, indicating that Notch signaling had kept label-retaining cells quiescent. Error bars represent SEM, n = 2 with a total number of 217 control and 235 DAPT-treated BrdU+ cells, p < 0.01, Rao-Scott test (modified χ2 test for clustered data). Scale bars (e, j, n), 10 μm.