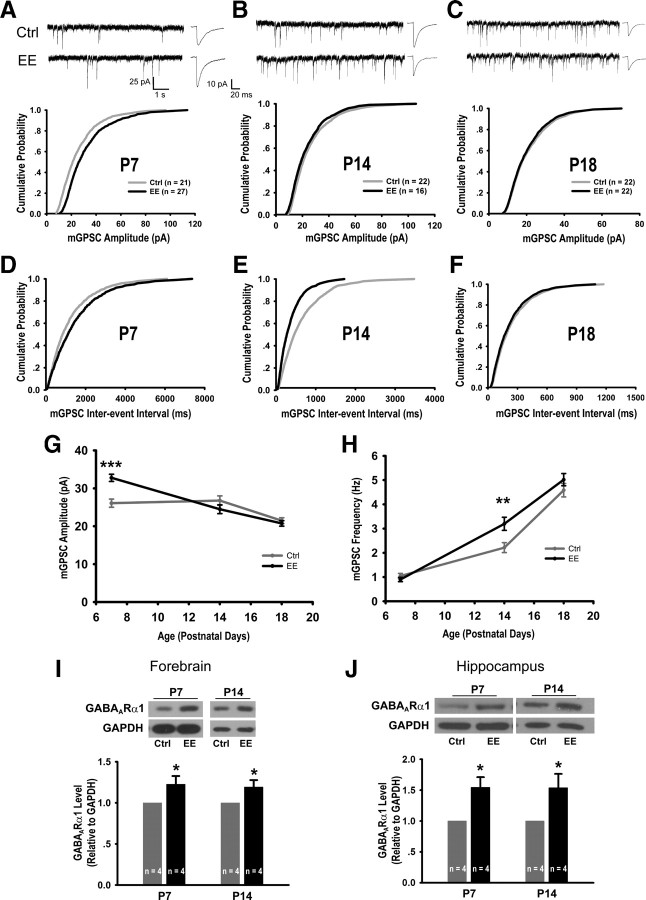
Figure 1.
EE rearing promotes GABAergic neurotransmission. A–C, Sample mGPSC recordings, averaged mGPSC waveforms, and cumulative mGPSC amplitude distributions from P7 (p = 0.01) (A), P14 (p = 0.31) (B), and P18 (p = 0.65) (C) control (Ctrl) and EE-reared mice. D–F, Cumulative mGPSC frequency distributions for P7 (p = 0.44) (D), P14 (p < 0.005) (E), and P18 (p = 0.40) (F) mice. G, Developmental course of average mGPSC amplitude: P7 (Ctrl: 26.08 ± 1.09 pA, EE: 32.76 ± 0.94 pA, p < 0.0001), P14 (Ctrl: 26.77 ± 1.23 pA, EE: 24.49 ± 1.17 pA, p = 0.20), and P18 (Ctrl: 21.47 ± 0.77 pA, EE: 20.75 ± 0.72 pA, p = 0.50). H, Developmental course of average mGPSC frequency: P7 (Ctrl: 1.05 ± 0.11 Hz, EE: 0.90 ± 0.09 Hz, p = 0.30), P14 (Ctrl: 2.20 ± 0.21 Hz, EE: 3.20 ± 0.27 Hz, p = 0.005), and P18 (Ctrl: 4.58 ± 0.28 Hz, EE: 5.02 ± 0.25 Hz, p = 0.25). I, Representative immunoblots and quantitation of GABAARα1 levels from forebrains of Ctrl and EE-reared mice: 1.23 ± 0.10 (p < 0.05) at P7 and 1.19 ± 0.08 at P14 (p < 0.05). J, Immunoblots and quantitation of GABAARα1 from hippocampi of Ctrl and EE mice: 1.55 ± 0.16 (p < 0.05) at P7 and 1.54 ± 0.23 (p < 0.05) at P14. In all graphs, error bars represent SEM; *p < 0.05, **p < 0.01, ***p < 0.001.

