
Figure 3.
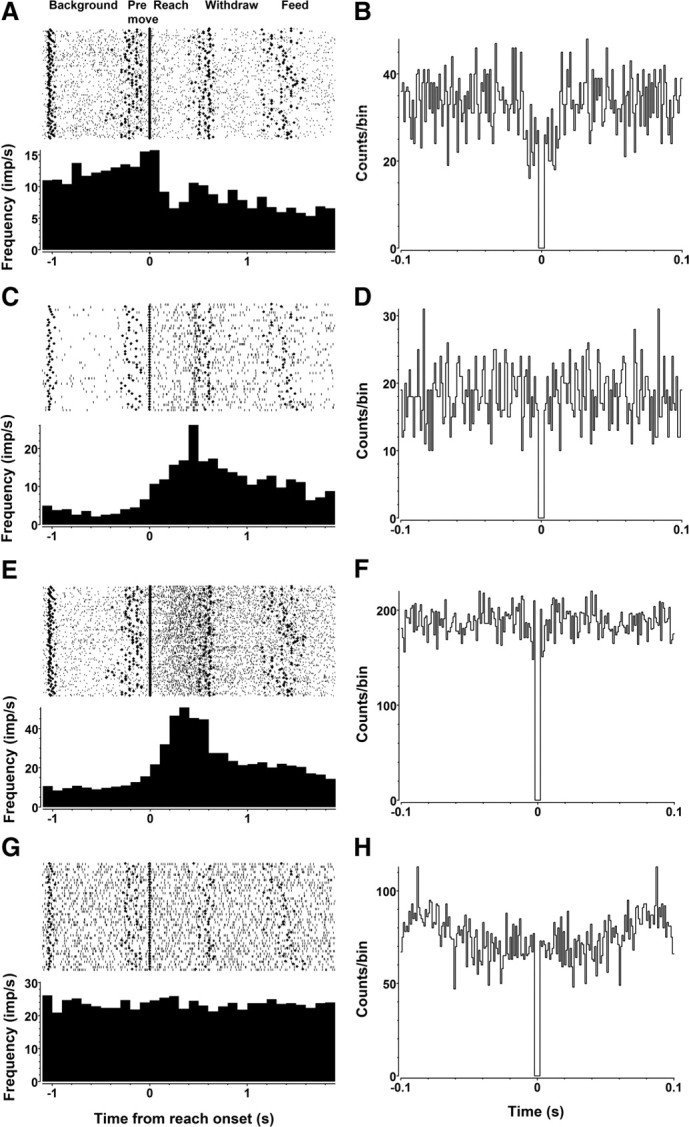
Examples of PSTHs and autocorrelograms of recorded neurons. Rasters and PSTHs (bin width 0.1 s) of two simultaneously recorded TR neurons (A, C), as well as a simultaneously recorded pair of TR (E) and NTR (G) neurons, are displayed in this figure. Rasters show neural spikes (gray dots) as well as the start of each task stage (black diamonds). Rasters and PSTHs have been aligned to the start of reach. The autocorrelograms (bin width 0.001 s) of the same neurons are displayed alongside (B, D, F, H), showing no evidence of oscillatory activity in the isolated units.