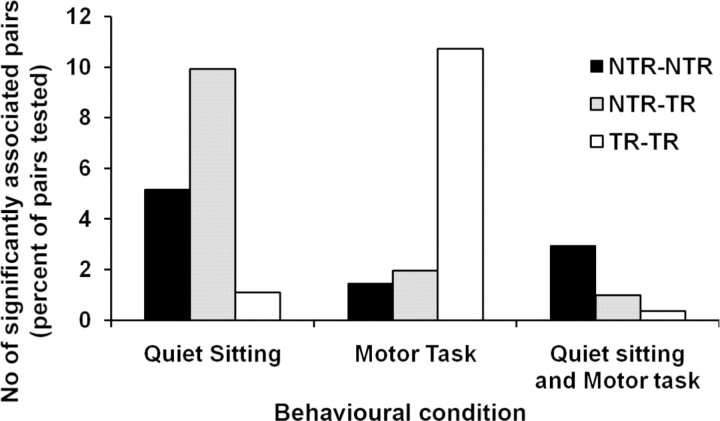
Figure 5.
Incidence of significant associations in neural activity during different behavioral conditions. The number of neuronal pairs that showed significantly coincident spike activity (expressed as a percentage of the total number of tested pairs) is illustrated as histograms for NTR–NTR, NTR–TR, and TR–TR neuronal pairs during different behavioral conditions.

