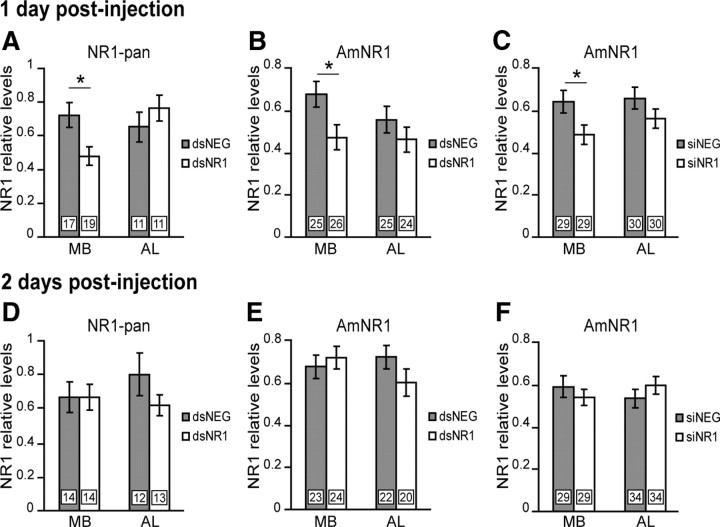
Figure 2.
Evaluation of the RNAi effect. Quantification of relative NR1 subunit levels in the MB and AL regions 1 or 2 d after injection of dsRNA (gray bars, dsNEG; white bars, dsNR1) or siRNA (gray bars, siNEG; white bars, siNR1) is shown. The expression levels were evaluated by quantitative Western blot, using NR1-pan (A, D) or AmNR1 (B, C, E, F). Each column represents the mean ± SEM of n measurements as indicated by the numbers on the bars. Asterisks indicate a significant reduction (*p < 0.05, Student's t test).

