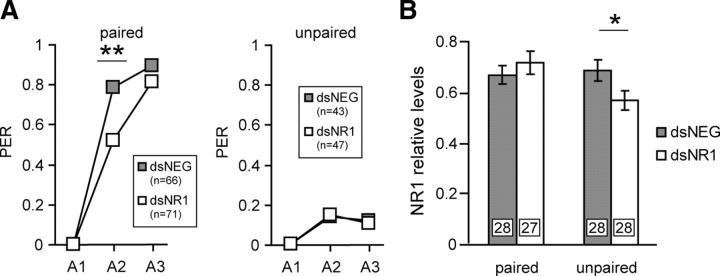
Figure 3.
Evaluation of the RNAi effect in conditioned honeybees. A, One day after the injection of dsRNA (gray squares, dsNEG; white squares, dsNR1), animals were subjected to three CS–US pairings (paired, A1–A3) or to three unpaired CS–US presentations (unpaired, A1–A3). n represents the number of animals that participated in the experiment. Brains were dissected 2 h later. PER, Percentage of animals that showed a PER during the CS presentation. B, The relative NR1 subunit levels were quantified in the MB region after injection of dsRNA (gray bars, dsNEG; white bars, dsNR1). The expression levels were evaluated by quantitative Western blot, using AmNR1. Each column represents the mean ± SEM of n measurements as indicated by the numbers on the bars. Asterisks indicate significant differences between groups (**p < 0.01, χ2 test; *p < 0.05, Student's t test).

