Figure 3.

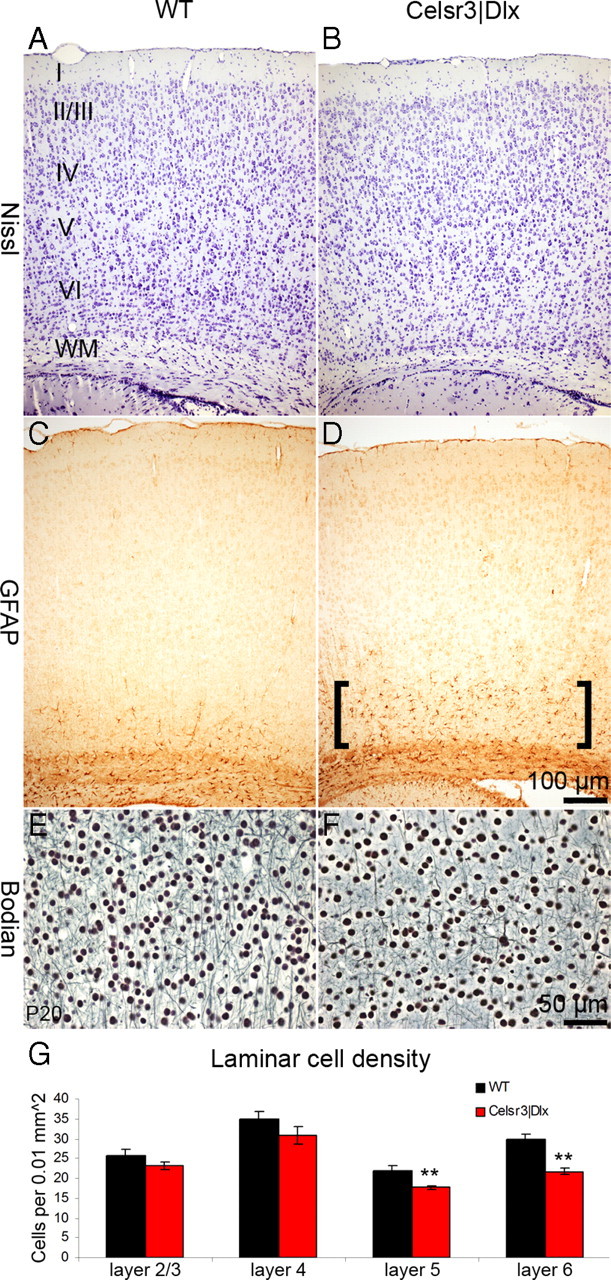
Abnormalities of cortical organization in Celsr3|Dlx mice. A, B, Nissl-stained sections show reduced neuronal density in deep mutant cortex. C, D, GFAP immunohistochemistry shows increased numbers of immunopositive astrocytes in deep cortical layers in the mutant (D, brackets). E, F, Reduction of axonal profiles in deep mutant cortex is demonstrated by the Bodian stain. G, Quantification of neuronal density in cortical layers indicates significant reduction of neuronal cell numbers in mutant layers 5 and 6. **p < 0.01, t test. Error bars indicate SEM. I–VI, Cortical layers I–VI; WM, white matter.
