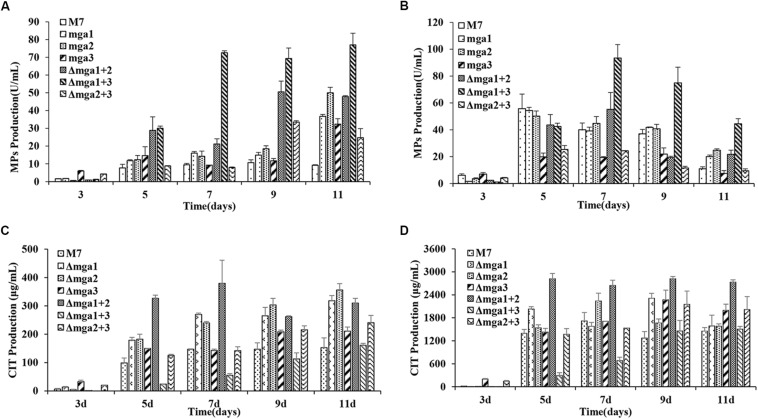
FIGURE 3.
MPs and CIT levels in Gα mutants and Monascus ruber M7. (A) The intracellular MP production of Gα mutants and M7. (B) The extracellular MP production levels of Gα mutants and M7. (C) The intracellular CIT production levels of Gα mutants and M7. (D) The extracellular CIT production levels of Gα mutants and M7. The error bars indicate the standard deviations of three independent cultures. Significantly different at P < 0.01.

