Figure 3.
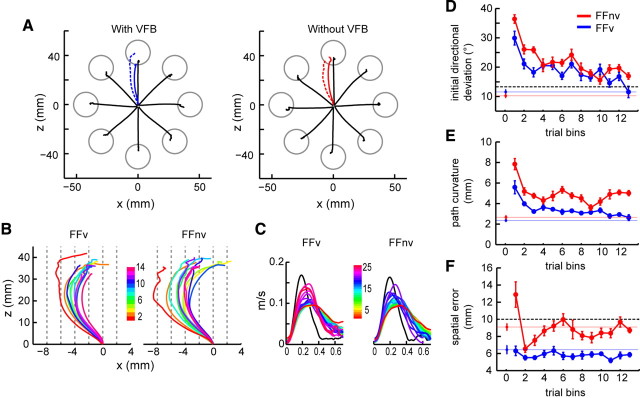
Behavioral performance during adaptations to force field. A, Average hand paths during prelearning null (black) and field reaches with and without VFB [averaged trajectories of the first (dashed line) and last 10 (solid line) field trials]. Data from all recording days. B, Average hand paths across field trials (10 trials/bin). The x-axis is enlarged to show lateral path deviations. C, Velocity profiles of null (black) and field (colored) reaches averaged across trials (five successful trials/bin). D–F, Means and ±1 SE of initial directional deviation (D), path curvature (E), and spatial errors (F) during adaptation (10 trials/bin). Isolated points and colored lines denote baseline values of the same directions used in the learning blocks. Dashed black lines in D and F denote error level that achieves reward. While spatial error was sufficiently reduced to achieve success, trajectory errors were not fully compensated without VFB.

