Figure 6.
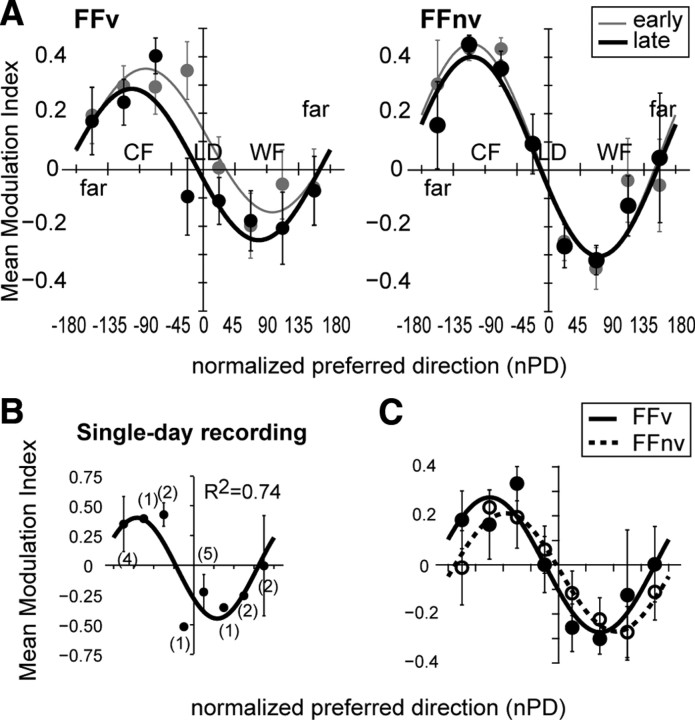
Adaptive modulation follows a cosine. A, Population modulation index (y-axis) as a function of normalized PDs (x-axis) is shown separately for early and late phases of adaptation and for each feedback condition. Each point denotes the mean modulation index across cells within a range of nPDs: near-LD (±45°), counter-field (−46 to −135°), with-field (46 to 135°), and far-LD (136 to 180°, −136 to −180°). Positive values indicate increased firing rates in field reaches. Population modulation index showed a good fit to cosine (R2 for early and late phases were = 0.91 ± 0.06 and 0.88 ± 0.09 for FFv, respectively, and 0.93 ± 0.07 and 0.95 ± 0.04 for FFnv, reespectively). Modulation index did not differ between early and late phases (paired Wilcoxon test, p > 0.10) nor between feedback conditions (Mann–Whitney, p < 0.05). The PDs (late phase: FFv = −100°; FFnv = −109°) and the amplitudes (late phase, FFv = 0.28; FFnv = 0.36) of the cosine fit were not significantly different with and without VFB (bootstrap, p > 0.10). Error bars are ±1 SE. B, As in A, but for a single-day recording where 15–20 cells modulated by force field were simultaneously recorded. C, Population modulation indexes corresponding to neural activity from 300 ms before movement onset to 200 ms after. Shown for late force field trials of each feedback condition. The population modulation index fit the cosine model well (R2 for FFv = 0.97; R2 FFnv = 0.88).

