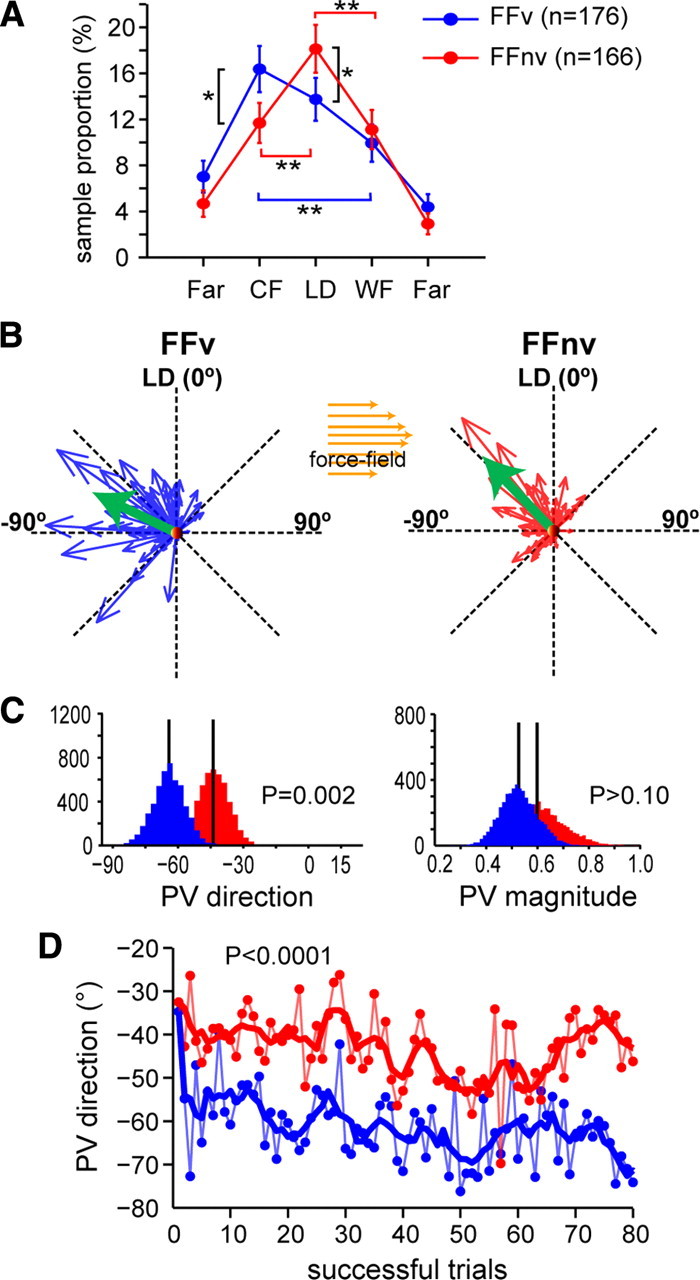
Figure 8.

Population distributions of modulated cells differ between feedback contexts. A, Population distribution of cells (n = 342) according to their nPDs and feedback condition. The FFv distribution is negatively skewed relative to the LD (−0.07), while the FFnv distribution was positively skewed (0.07). Skewness was calculated as follows: S = E(x − μ)3/σ3 where μ is the mean of x, σ is the standard deviation of x, and E(t) is the expected value of t. Error bars are ±1 SE. Brackets correspond to significant comparisons between nPD ranges within (colored) and between feedback (black) conditions (*p = 0.01; **p < 0.001). B, Population vectors during force-field adaptations (green) did not point to the hand movement direction. In both feedback conditions, they pointed toward the compensatory direction [FFv = −64.2° (−65.3°, −63.2°); FFnv = −43.6° (−44.5°, −42.8°)]. Similar results were obtained when PVs were calculated separately for each monkey (a, FFv = −51.7°; FFnv = −33.3°; bootstrap, p = 0.03; B, FFv = −72.0°; FFnv = −46.0°; bootstrap, p = 0.003). PVs were calculated using mean firing rates of late force-field trials (41–80). C, Histograms of the direction and magnitude of PVs shown in B, obtained from resampling using the bootstrap technique, show significant differences in direction but not in magnitude. D, PV direction calculated trial-by-trial (dotted line, raw data; solid line, smoothed data) during adaptations to force fields with and without VFB.
