Figure 3.

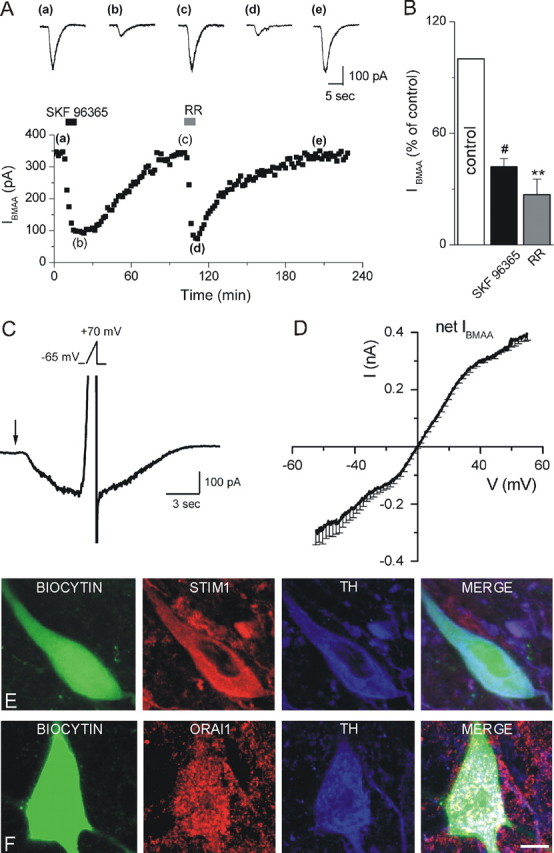
TRPCs mediate IBMAA. A, Time course of IBMAA amplitude in response to perfusion with SKF 96365 (100 μm) and RR (20 μm). Top, Raw traces of IBMAA acquired at the times indicated by the corresponding letters in the plot. B, Histogram of IBMAA amplitude, expressed as percentage of control (white bar), following exposure to SKF 96365 and RR (n = 8 and 6, respectively). C, IBMAA recorded from a DAergic neuron (Vhold = −65 mV) in response to a BMAA puff (3 mm, 2 s, arrow). At the peak of the inward current a voltage ramp (Vramp, −65 to +70 mV, 1.5 s, see inset) is executed. D, Mean I–V of the net IBMAA obtained from four cells. E, F, Confocal laser scanning microscope images of SNpc DAergic neurons loaded with biocytin (green) and stained with TH (blue) antibody. E, Triple labeling with STIM1 (red) antibody. F, Triple labeling with Orai1 (red) antibody. As shown in the merge images, biocytin-loaded TH-positive neurons are immunopositive for both STIM1 (E) and Orai1 (F). Scale bar: 6 μm. **p < 0.01, #p < 0.0001.
