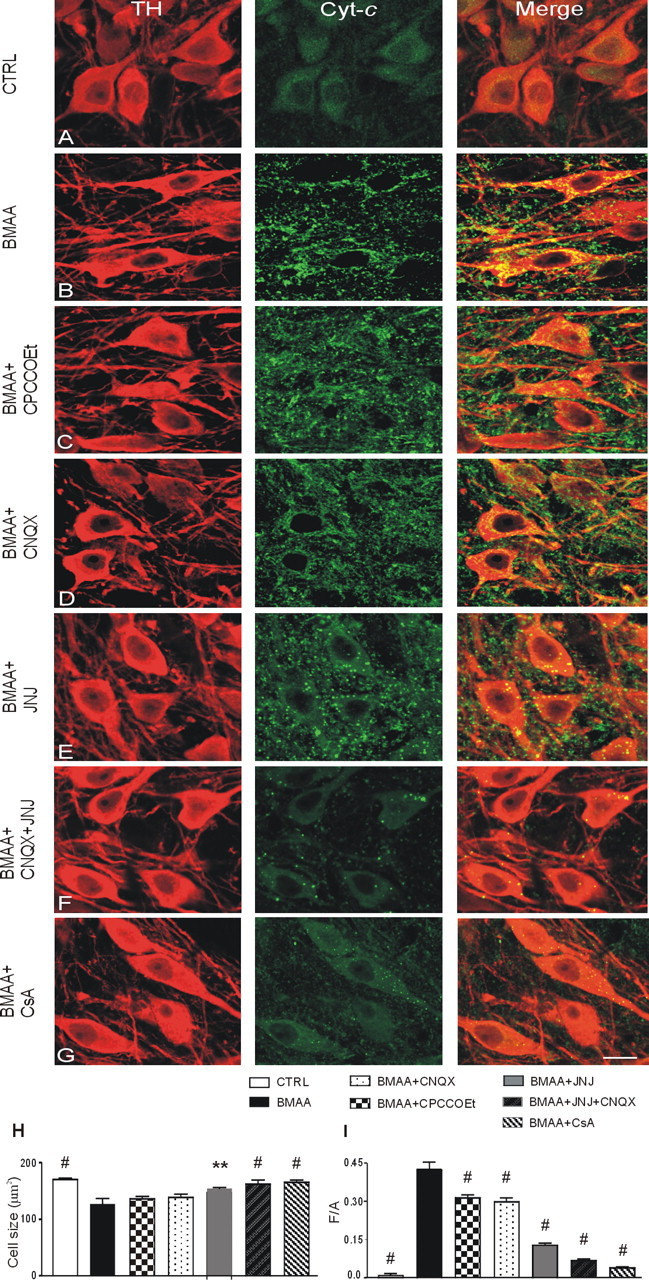
Figure 8.

Prolonged exposure to BMAA causes neuronal shrinkage and massive cyt-c release into the cytosol of SNpc DAergic neurons. A–G, cyt-c and TH double-labeling confocal images of control (CTRL; A) and BMAA- (B), BMAA + CPCCOEt- (C), BMAA + CNQX- (D), BMAA + JNJ- (E), BMAA + CNQX + JNJ- (F), and BMAA + CsA- (G) treated slices. H, I, Histograms of soma cell size of TH-immunoreactive neurons (in square micrometers) (H) and densitometric values of cyt-c release expressed as mean fluorescence of individual cells normalized to total cellular surface (F/A) (I) in CTRL, BMAA, BMAA + CPCCOEt, BMAA + CNQX, BMAA + JNJ, BMAA + CNQX + JNJ, and BMAA + CsA groups. Data are reported as means ± SEM (n = 200 cells per group). Statistical comparison versus BMAA group, **p < 0.01, #p < 0.0001. Scale bar: 18 μm.
