Figure 1.

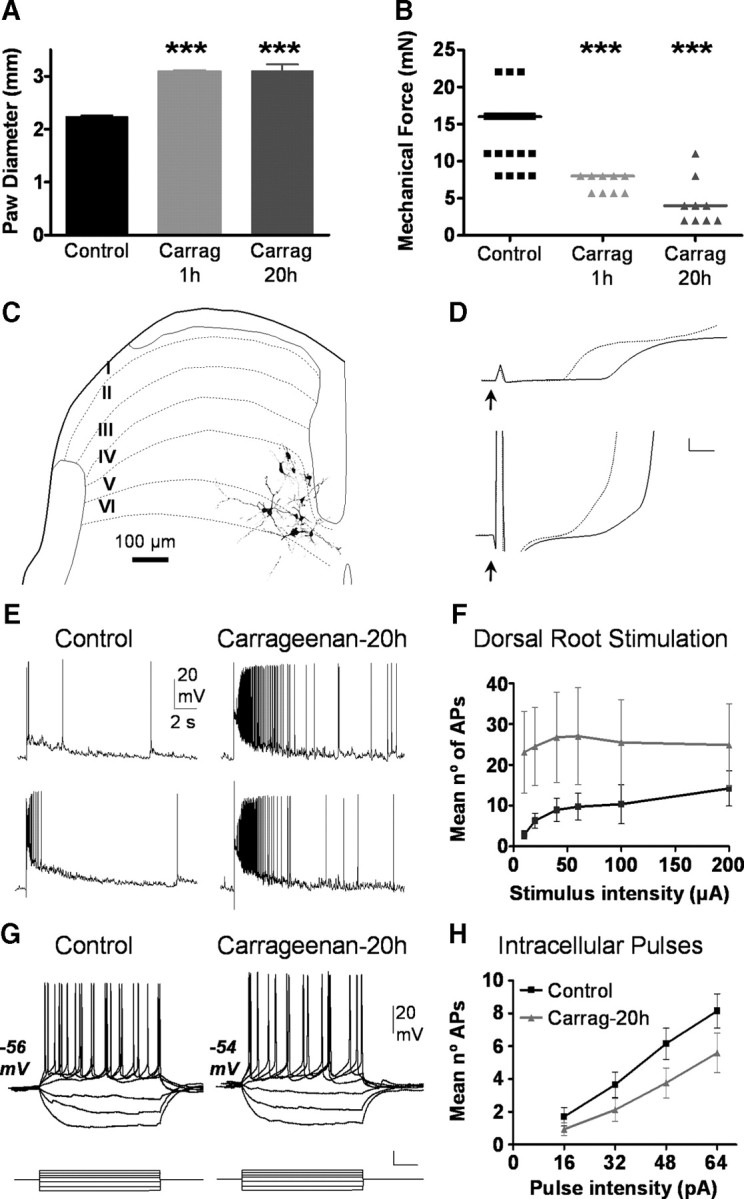
Behavioral assessment of inflammation and neuronal effects at 20 h posttreatment. A, Paw diameters measured in control and carrageenan-treated groups are shown. B shows withdrawal thresholds to punctuate mechanical stimuli applied with Von Fray filaments. Asterisks in A and B indicate significant differences (Mann–Whitney test; p < 0.001). C shows mayor morphological traits and laminar distribution of 11 neurons recovered after histological processing. Reconstructions are situated on a schematic drawing of a transverse section of the dorsal horn in which laminar boundaries are delineated and labeled with roman numbers. Voltage recordings shown in D correspond to the first milliseconds of neuronal responses to low intensity (200 μs and threshold current; upper traces) and high intensity dorsal root stimulation (200 μs and 200 μA, lower traces). Responses from control (continuous lines) are compared with those of injected with carrageenan 20 h earlier (doted lines). Resting membrane potential was −54 mV for all traces; cal. bars 4 mV, 1 ms. Voltage recordings in E show representative responses of dorsal horn neurons from control (left) and 20 h after carrageenan injection (right) to a low intensity stimulus (200 μs and 10 μA; top) and to high intensity stimulus (200 μs and 200 μA; bottom) applied to the dorsal root (RMP −58 mV and −57 mV, respectively). Graph in F shows quantitative data for neurons under control conditions (black squares, n = 19) and after 20 h of inflammation (gray triangles, n = 16). Difference between groups was significant (p < 0.001; ANOVA). G shows responses to intracellular current injection obtain from neurons in control and treated conditions as indicated. Both figures show typical tonic firing patterns obtained in response to intracellular current pulses (unlabeled cal bars are 0.1 nA and 0.1 s). The graph in H shows pooled data on the action potentials elicited in response to intracellular current pulses in both groups (Control: black, n = 19; carrageenan 20 h: gray, n = 16). Difference between groups was significant (p < 0.01; ANOVA). Carrag, Carrageenan.
