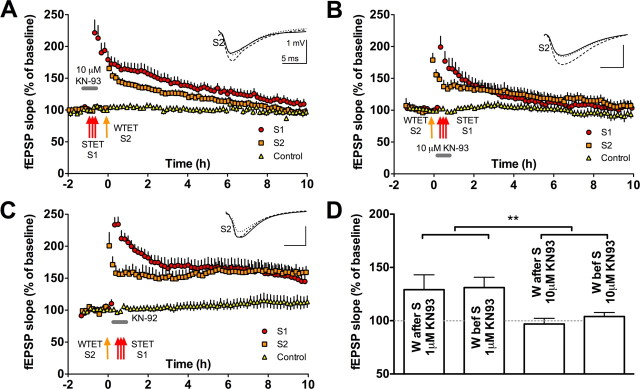
Figure 6.
A higher concentration of KN-93 has less selective effects than a lower concentration. A, B, Higher concentrations of KN-93 fail to dissociate synapse-specific and cell-wide processes in late-LTP, in contrast to data in Figure 2 with 1 μm KN-93. A, A weakly stimulated pathway (S2) failed to show late-LTP (S2 vs control 10 h, t = 0.1, p ≥ 0.05) when the stimulation was given 20 min after a strong tetanus to S1 if the higher concentration of 10 μm KN-93 was present during LTP induction. The strongly stimulated pathway also fails to show late-LTP (S1 vs control 10 h, t = 1.4, p ≥ 0.05; n = 9). B, The rescue of early-LTP into late-LTP is also not seen in S2 (S2 vs control 10 h, t = 1.7, p ≥ 0.05) if tetanization is given when 10 μm KN-93 is present during S1. S1 also fails to maintain late-LTP (S1 vs control 10 h, t = 0.9, p ≥ 0.05; n = 7). C, The rescue of early-LTP into late-LTP in a weakly tetanized pathway (S2) is seen even if S1 strong tetanization is delivered when KN-92 is present (S2 vs control 10 h after tetanus, t = 3.5, p < 0.01; n = 5). D, Bar graph showing differences in the level of potentiation 10 h after stimulation between the two concentrations of KN-93 used in Figures 4 and 6 (two-way ANOVA, F = 7.7, p < 0.01). The order of stimulation and drug application had no effect (F = 0.14, p > 0.05). Error bars indicate SEM. **p < 0.01. Symbols as in Figure 2. STET, Strong tetanization; WTET, weak tetanization.

