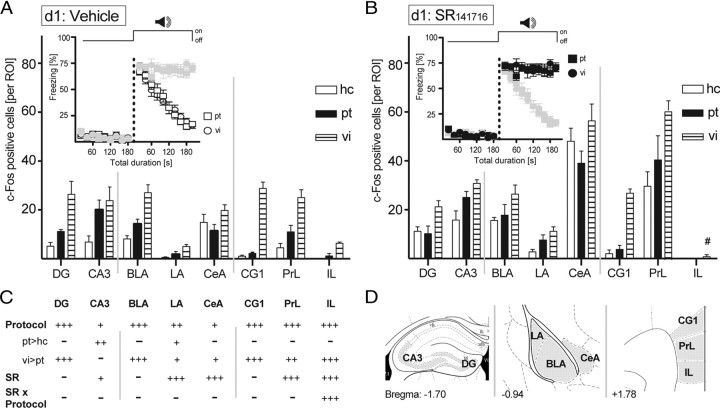
Figure 6.
Neuroanatomical signature of extinction training. B6N mice received a single tone–shock pairing at d0 and were exposed to either a pt of 200 s duration (compare Fig. 2 A) or to ten 20 s tones at vi (compare Fig. 2 A), or stayed in their hc 24 h later (d1). A, B, Half of the animals of each group were treated with vehicle (A), and the other half were treated with the CB1 receptor antagonist SR141716 (3 mg/kg) (B) 1 h before tone presentation (in the case of pt and vi). All animals were killed 70 min after the end of the exposure (or after the same time in the home cage), and the brains were processed for c-Fos immunohistochemistry (A, B). Insets show the development of the freezing responses before and during tone presentations, whereby freezing data of the animals of the same treatment groups as used for immunohistochemistry in the respective figure panel are shown in black and those of the other treatment groups in gray. C, Results of the two-way ANOVAs with the main factors protocol (P) and treatment (SR), performed separately per brain structure (− p > 0.05; + p < 0.05; ++ p < 0.01; +++ p < 0.001; #significant SR–protocol interaction). D, The total number of c-Fos-positive neurons was counted bilaterally in the ROIs in one section per mouse. ROIs were defined according to the mouse brain atlas (Franklin and Paxinos, 1997; compare Fig. 1). Values are expressed as the mean ± SEM (n = 5 per group).

