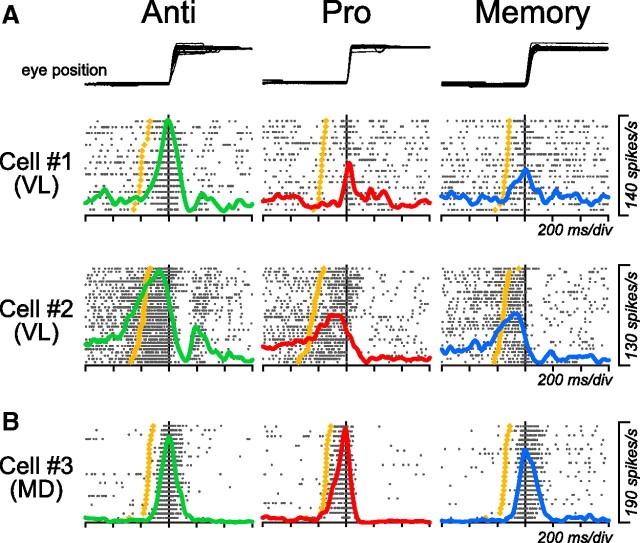
Figure 3.
Comparison of neuronal activity between three saccade paradigms. A, Two examples of VL neurons. B, An MD neuron. In all panels, data are aligned on saccade initiation (vertical line). Trials are sorted by saccade latency, and the rasters and the corresponding spike density are shown for saccades in the preferred direction only. The yellow dot on each raster line indicates the time of the fixation point offset.

