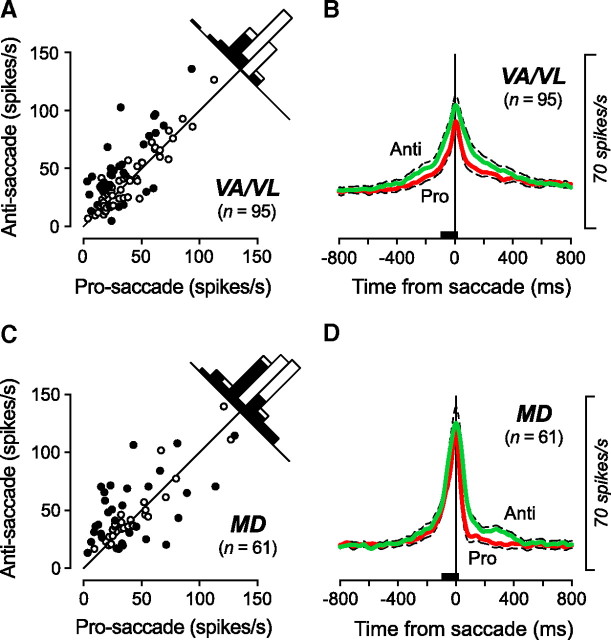
Figure 4.
Quantitative analyses of the saccade-related activity for different tasks in the preferred direction. A, C, Each data point compares the firing rate during antisaccades with that during prosaccades for neurons in the VA/VL (A) and in the MD (C) thalamus. Neuronal activity was measured for a 120 ms interval starting from 100 ms before saccade initiation (black bars in B and D). Filled symbols indicate the data showing a statistically significant difference according to multiple comparisons (Scheffé, p < 0.05). B, D, Time courses of the population activity during anti/prosaccades for neurons in the VA/VL (B) and in the MD (D) nuclei. The traces are the means of spike densities for individual neurons and are aligned on saccade initiation (vertical line). Dashed traces indicate plus or minus SEM.

