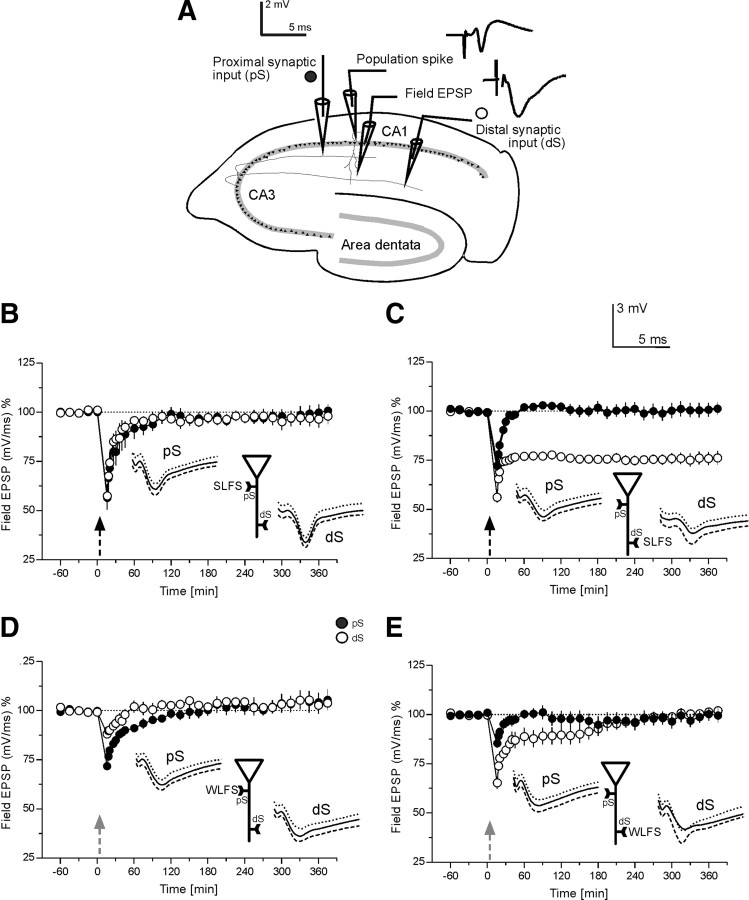
Figure 1.
Induction and maintenance of different LTD forms depending on the region of its induction at apical CA1 neurons. The time course of field EPSP recordings are shown. A, Schematic representation of a transversal rat hippocampal slice with electrode locations to stimulate two separate synaptic inputs pS (proximal) and dS (distal) in the stratum radiatum of the CA1 region is shown. Further, the locations of the recording electrodes for the population spike as well as the field EPSP from a single, stimulated neuronal population are provided. The analog traces are representative examples of recorded potentials at the two recording electrodes. B, The time course of the slope of the field EPSP after SLFS within the proximal region of the apical dendrites pS is presented (filled circles). Open circles represent the recordings from the distally located control synaptic pathway dS (n = 9). STD in the pS and a transient heterosynaptic depression in dS was seen. C, Application of SLFS to distally located inputs dS are shown, which resulted in L-LTD (open circles). Filled circles represent recordings from the proximally located control synaptic pathway pS which expressed a heterosynaptic transient potentiation; (n = 20). D, The time course of the slope of the field EPSP after WLFS to pS is provided, which only expressed STD (filled circles). Open circles represent recordings from the control dS showing a transient heterosynaptic depression (n = 7). E, Application of WLFS to dS resulted in E-LTD (open circles). Filled circles represent recordings from the control synaptic pathway pS in this series of experiments showing a heterosynaptic transient depression; (n = 7). Analog traces represent typical field EPSPs 30 min before the normal time point “0,” i.e., the time point where SLFS or WLFS was applied (dashed line); 30 min (solid line) and 6 h (dotted line) after LFS of input pS or dS. The analog traces for the corresponding control inputs were recorded at the same time points. Calibration bar for all analog traces: 3 mV/5 ms. Arrows indicate the time point of stimulation of synaptic input pS or dS (SLFS is symbolized as dashed arrow, WLFS by gray, dashed arrow). The neuronal schemes presented in each data panel should emphasize the used stimulation protocol in the corresponding experiment: pS or dS.

