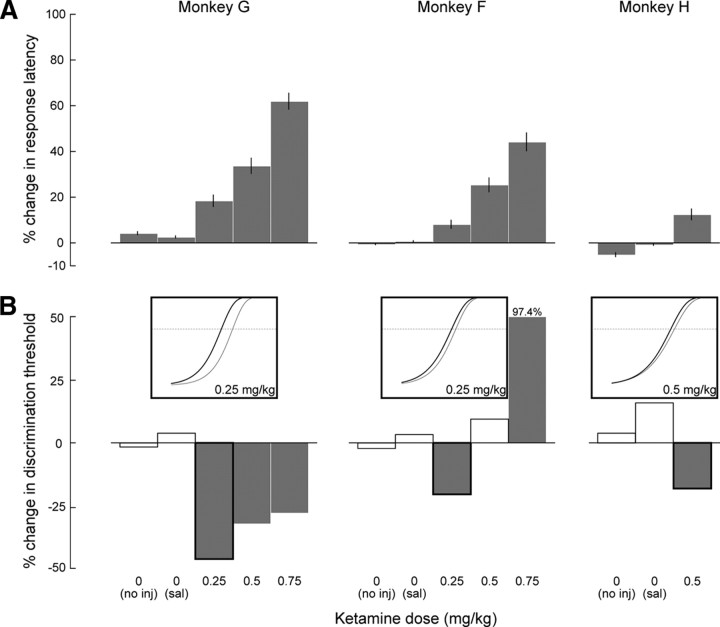
Figure 3.
Changes in response latency and discrimination threshold following ketamine and control treatments. A, Percentage (±95% CI) change in response latency for each animal and for each treatment, compared with corresponding control data (monkey G, 151 ± 0.4 ms; monkey F, 212 ± 0.8 ms; monkey H, 178 ± 0.7 ms). All percentage changes were significantly different from 0 (p < 0.05, t test). B, Percentage change in discrimination threshold for each animal and for each treatment, compared with corresponding control data (monkey G, 8.0 cd/m2 or 43% contrast difference; monkey F, 6.0 cd/m2 or 36.1%; monkey H, 9.2 cd/m2 or 46.5%). Bars with black outlines indicate a significant difference in accuracy in at least one of the intermediate stimulus luminance differences (see Materials and Methods) (p < 0.05, χ2). Insets illustrate the shift in the psychometric function (axis labels as in Fig. 2D) for three example sessions (monkeys G and F, 0.25 mg/kg; monkey H, 0.5 mg/kg). Treatments with no injection (no inj) and saline injections (sal) are identified as treatments with 0 mg/kg ketamine dose.

